
Headline Inflation
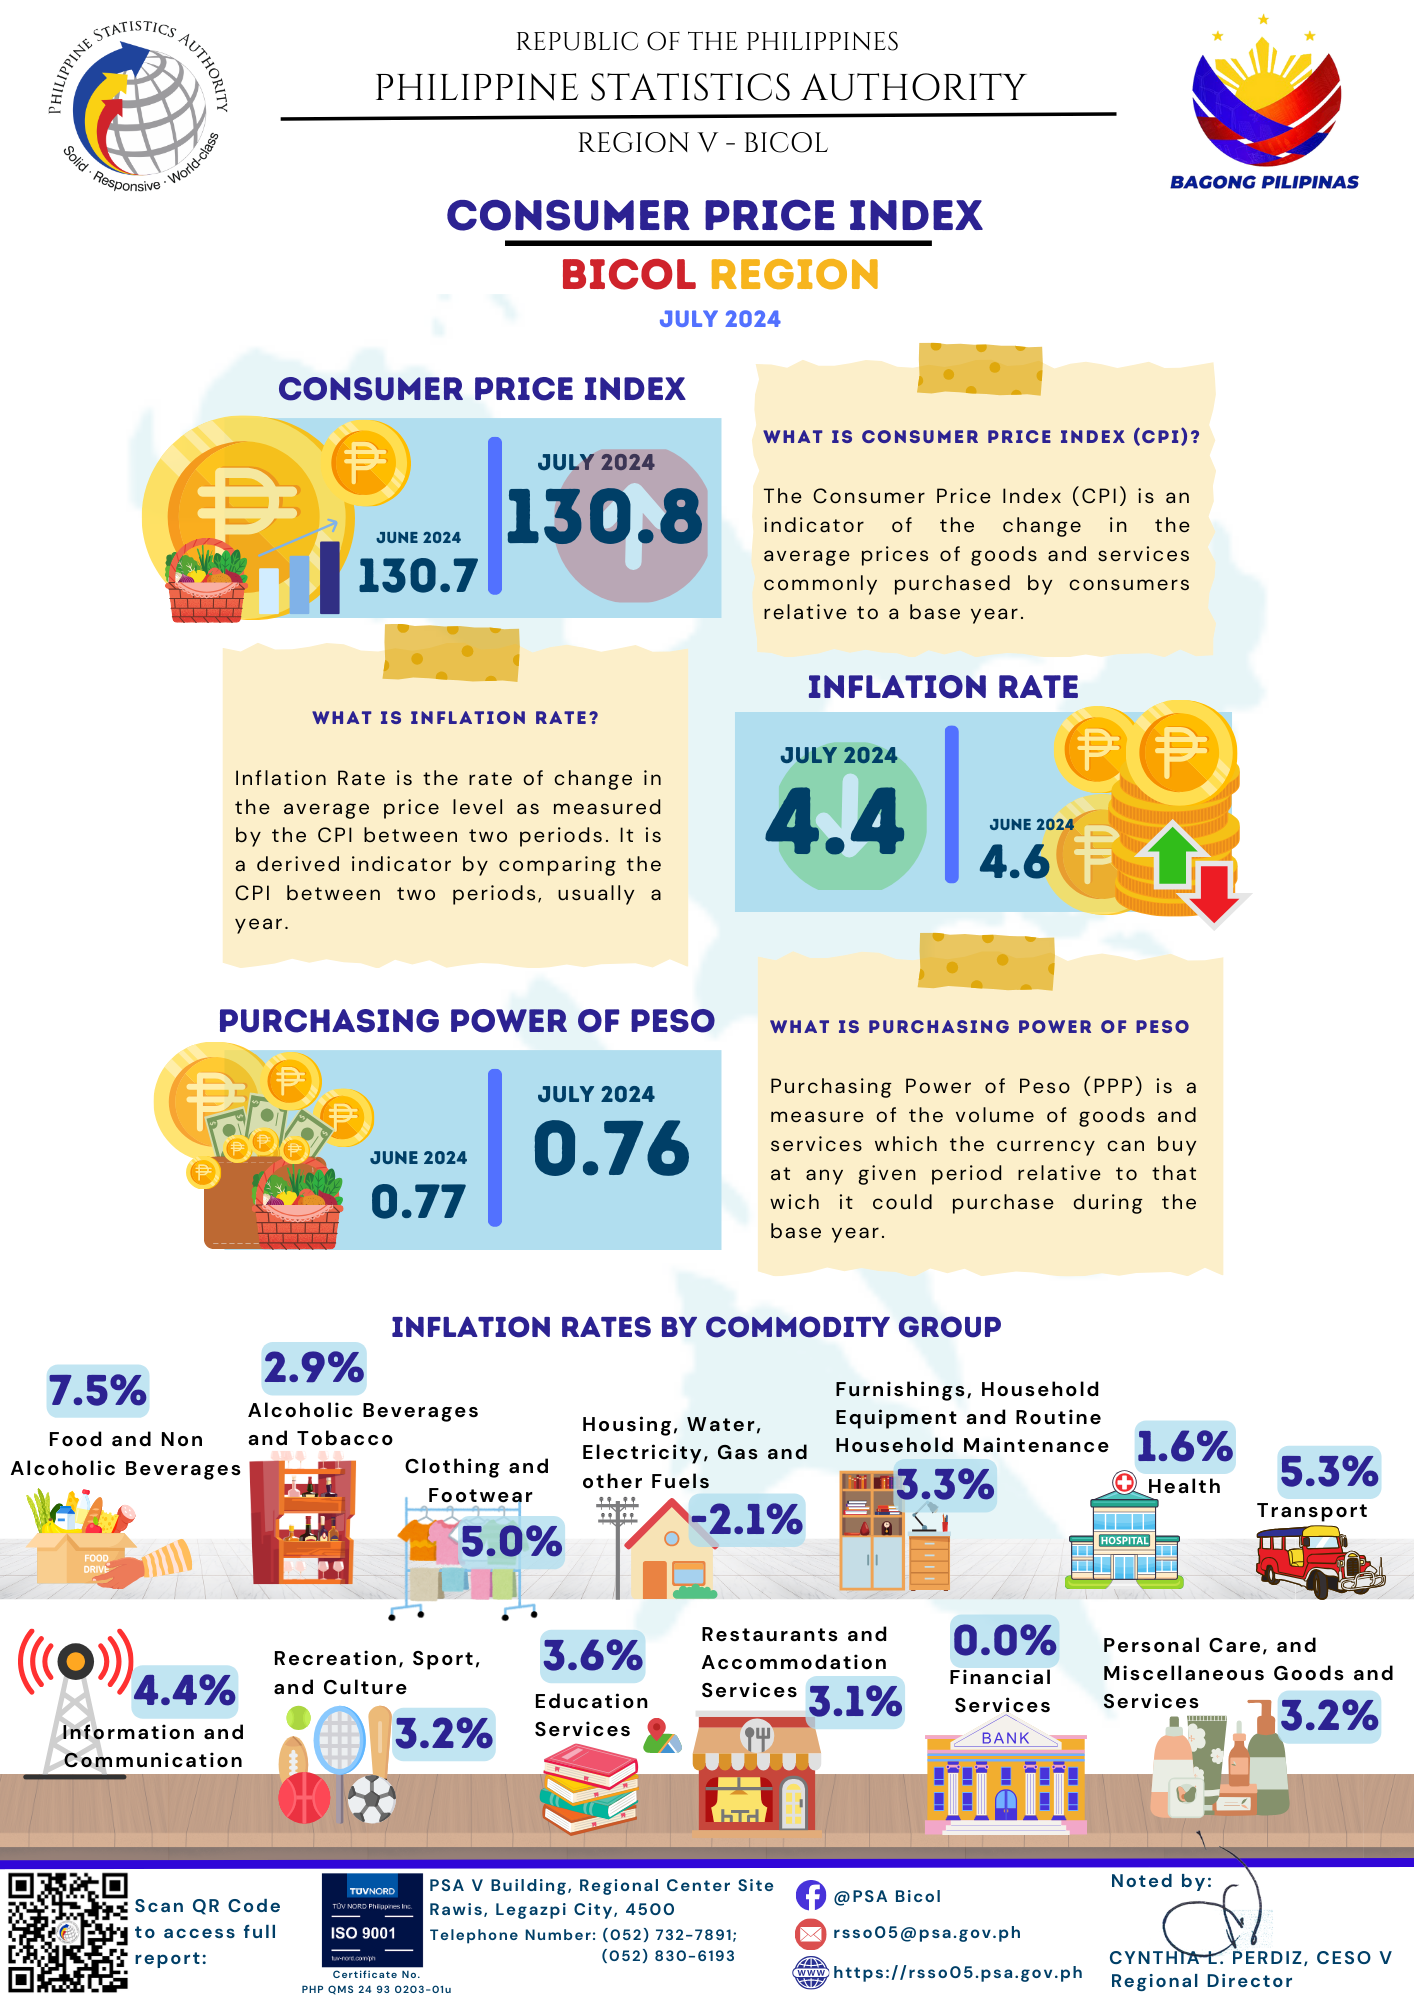
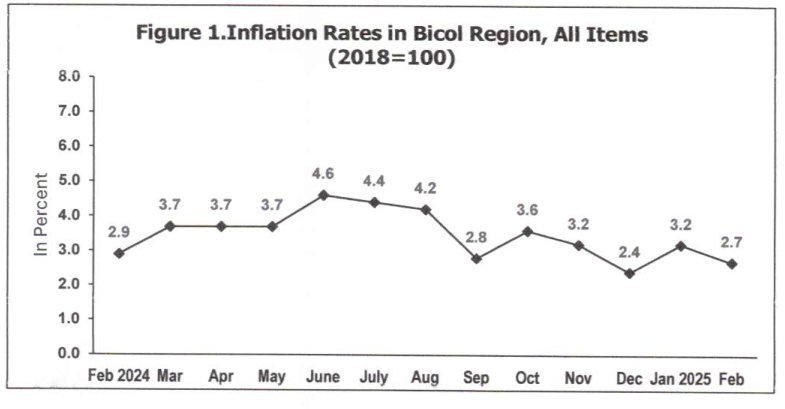
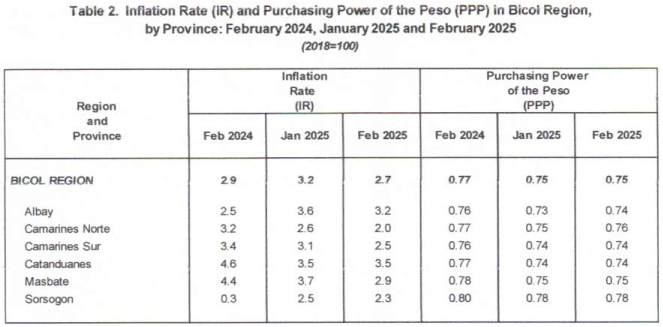
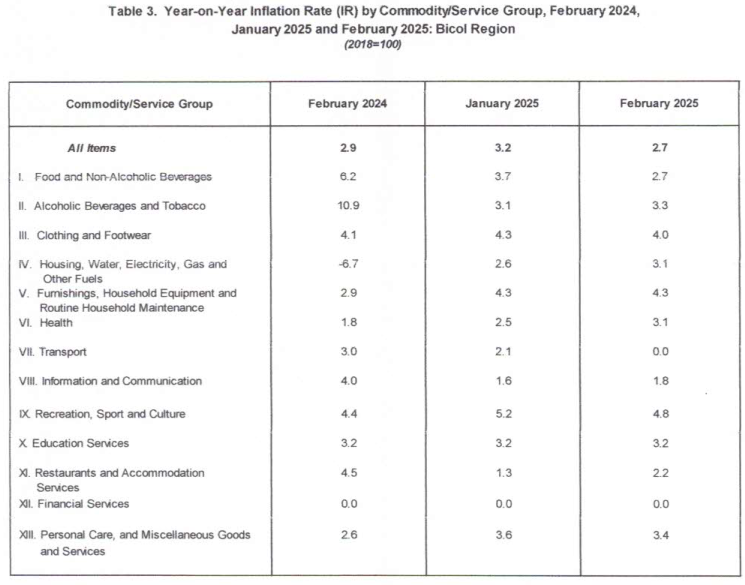
The region’s headline inflation or overall inflation slowed down to 2.7 percent in February 2025 from 3.2 percent in January 2025. In February 2024, the inflation rate was higher at 2.9 percent.
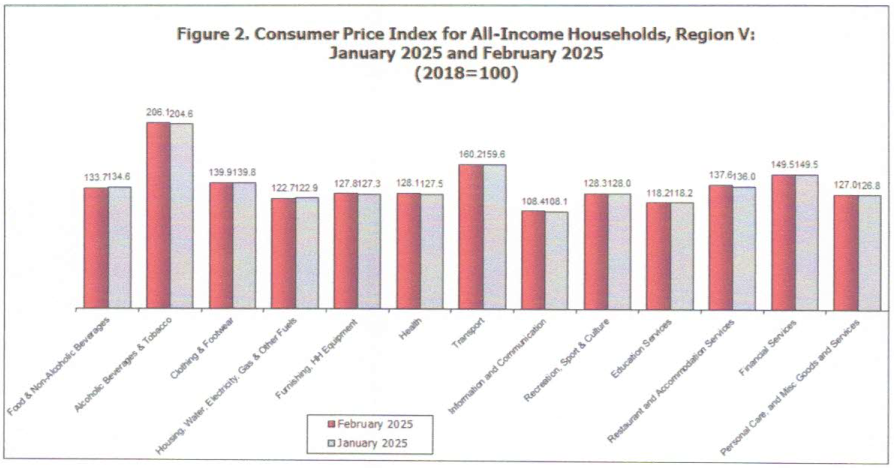
Main Drivers to the Downward Trend of the Headline Inflation
The downtrend in the overall inflation in February 2025 was primarily influenced by the slower annual increment in the index of food and non-alcoholic beverages at 2.7 percent during the month from 3.7 percent in January 2025. Also contributing to the downtrend was transport with a slower year-on-year increase of 0.0 percent in February 2025 from
2.1 percent annual increment in the previous month.
Slower annual increments were also noted in the indices of the following commodity groups during the month:
a. Clothing and Footwear, 4.0 percent from 4.3 percent;
b. Recreation, sport and culture, 4.8 percent from 5.2 percent; and
c. Personal care, and miscellaneous goods and services, 3.4 percent from 3.6 percent
In contrast, the following commodity groups registered higher inflation rates during the month:
a. Alcoholic beverages and tobacco, 3.3 percent from 3.1 percent;
b. Housing, water, electricity, gas and other fuels, 3.1 percent from 2.6 percent;
c. Health, 3.1 percent from 2.5 percent;
d. Information and communication, 1.8 percent from 1.6 percent
e. Restaurants and accommodation services, 2.2 percent from 1.3 percent
The indices of the rest of the commodity groups retained their respective previous month’s inflation rates in February 2025.
Main Contributors to the Headline Inflation
The top three commodity groups contributing to the February 2025 overall inflation were the following:
a. Food and non-alcoholic beverages with 45.5 percent share or 1.2 percentage points;
b. Housing, water, electricity, gas and other fuels with 21.2 percent share or
0.6 percentage point; and
c. Personal care, and miscellaneous goods and services with 5.4 percent share or 0.2 percentage point.
Food Inflation
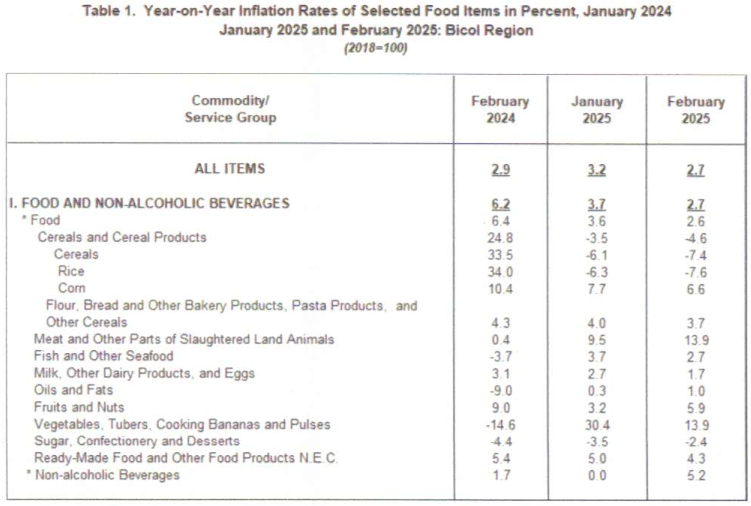
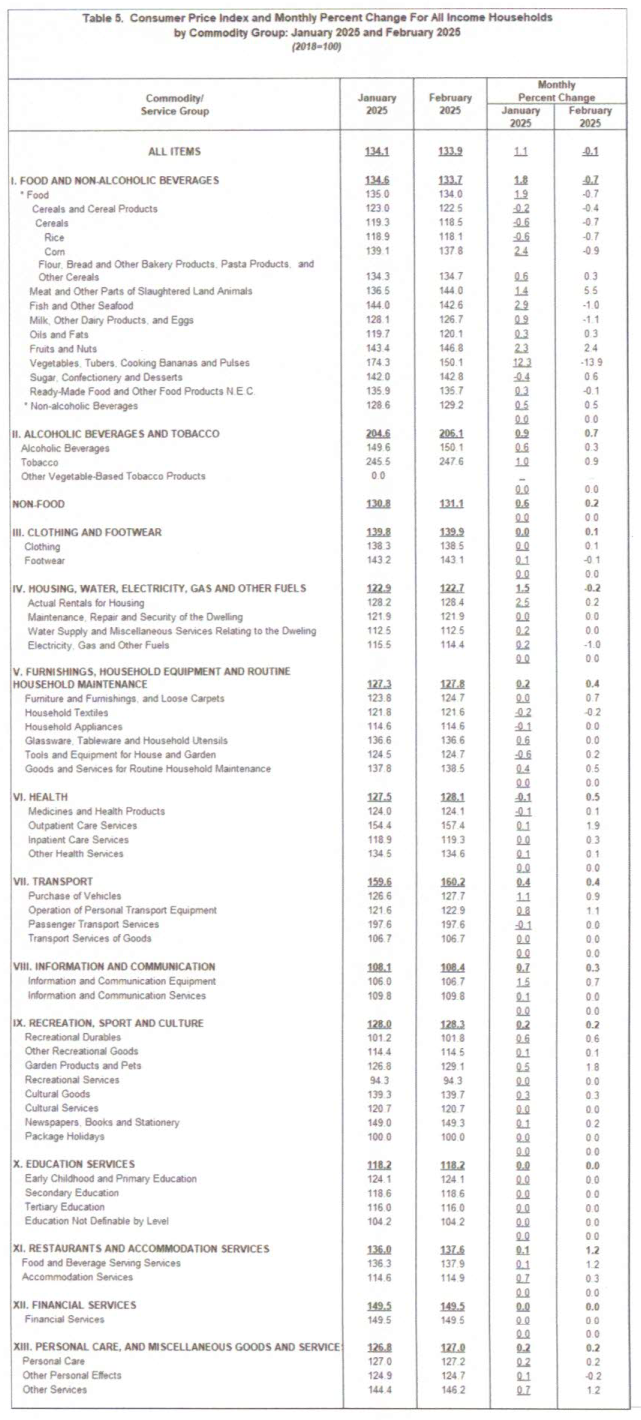
Food inflation at the regional level decreased to 2.6 percent in February 2025 from
3.6 percent in the previous month. In February 2024, food inflation was higher at 6.4 percent.
Main Drivers to the Downward Trend of Food Inflation
The deceleration of food inflation in February 2025 was primarily brought about by the slower year-on-year increase in the index of vegetables, tubers, plantains, cooking bananas and pulses at 13.9 percent during the month from 30.4 percent and fish and other seafood at 2.7 percent from 3.7 percent in January 2025. Faster annual decline was also observed in the index of rice at 7.6 percent during the month from 6.3 percent in
January 2025.
Moreover, lower annual rates were noted in the indices of the following commodity groups during the month:
a. Corn, 6.6 percent from 7.7 percent;
b. Milk, other dairy products and eggs, 1.7 percent from 2.7 percent; and
c. Ready-made food and other food products, 4.3 percent from 5.0 percent
On the contrary, higher annual growth rates during the month were observed in the indices of the following food groups:
a. Meat and other parts of slaughtered land animals, 13.9 percent from 9.5 percent;
b. Oils and fats, 1.0 percent from 0.3 percent; and
c. Fruits and nuts, 5.9 percent from 3.2 percent.
Slower annual decline was observed in the index of sugar, confectionery and desserts with 2.4 percent in February 2025 from 3.5 percent in the previous month.
Main Contributors to the Food Inflation
Food inflation shared 40.0 percent or 1.1 percentage points to the overall inflation in February 2025. The top three food groups in terms of contribution to the food inflation during the month were the following:
a. Meat and other parts of slaughtered land animals, with a share of 86.9 percent or 2.3 percentage points;
b. Vegetables, tubers, plantains, cooking bananas and pulses with a share of 42.1 percent or 1.1 percentage points; and
c. Fish and other seafood with a share of 16.2 percent or 0.4 percentage point.
DEFINITIONS AND CONCEPTS
Consumer Price Index - a statistical measure of the change in average retail prices of a fixed basket of goods and services bought by a specific group of consumers in a given area in a given period of time.
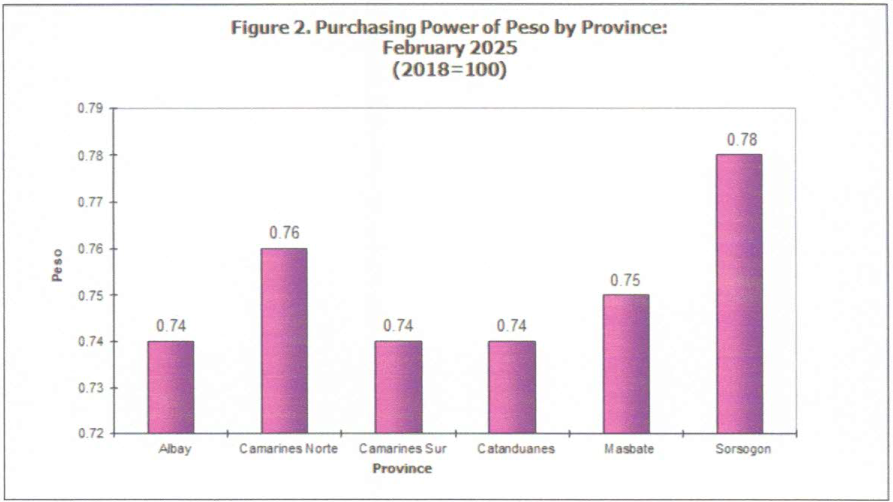
Purchasing Power of the Currency or Peso (PPP) - a measure of the volume of goods and services which the currency can buy at any given period relative to that which it could purchase during the base year. It is computed as the reciprocal of the CPI for the period under review multiplied by 100.
Market Basket - the total number of goods and services in constant amounts and qualities which are samples of the goods and services available in the market and included in the construction of the index. CPI market basket was selected to represent the composite price behavior of all goods and services purchased by consumers. Composition of the 2012 market basket was determined based on the results of the 2018 update of the 2012 basket. Provinces and selected cities had own market baskets.
Base Year - it identifies the base period with which the index relates. It is a period of time chosen as reference on which a price index is computed. The index for the base year is 100.
Retail Price - the actual price at which retailers sell a commodity on spot or earliest delivery, usually in small quantities for consumption and not for resale. It is confined to transactions on cash basis in the free market and excludes black-market prices and prices of commodities that are on sale as in summer sales, anniversary sales, Christmas sales, etc.
Percent Change - the percent point change expressed as percent of the index of the earliest date.
Inflation Rate - the annual rate of change or the year-on-year change of the CPI. Inflation is interpreted in terms of declining purchasing power of money.
Note to Users:
The monthly Consumer Price Index is computed based on the average retail prices of goods and services collected during the first week and mid-month of the reference month.
")


")