
Release Date :
Reference Number :
2024-08-016-CT
Headline Inflation
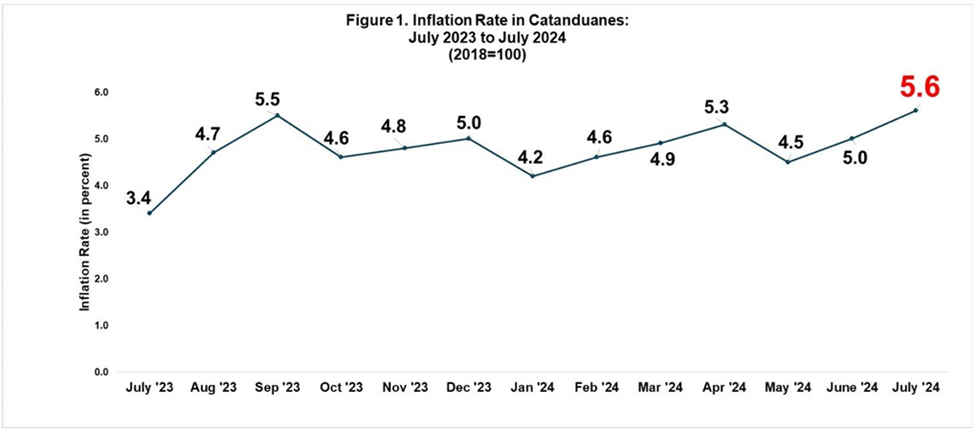
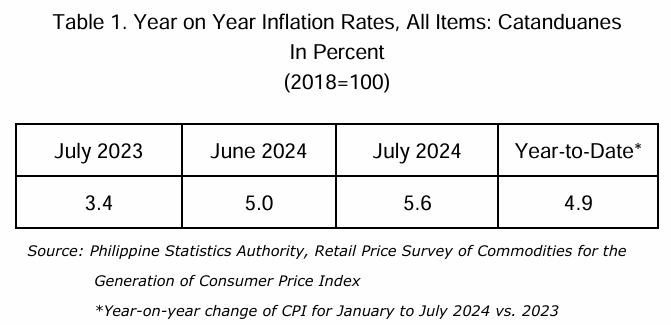
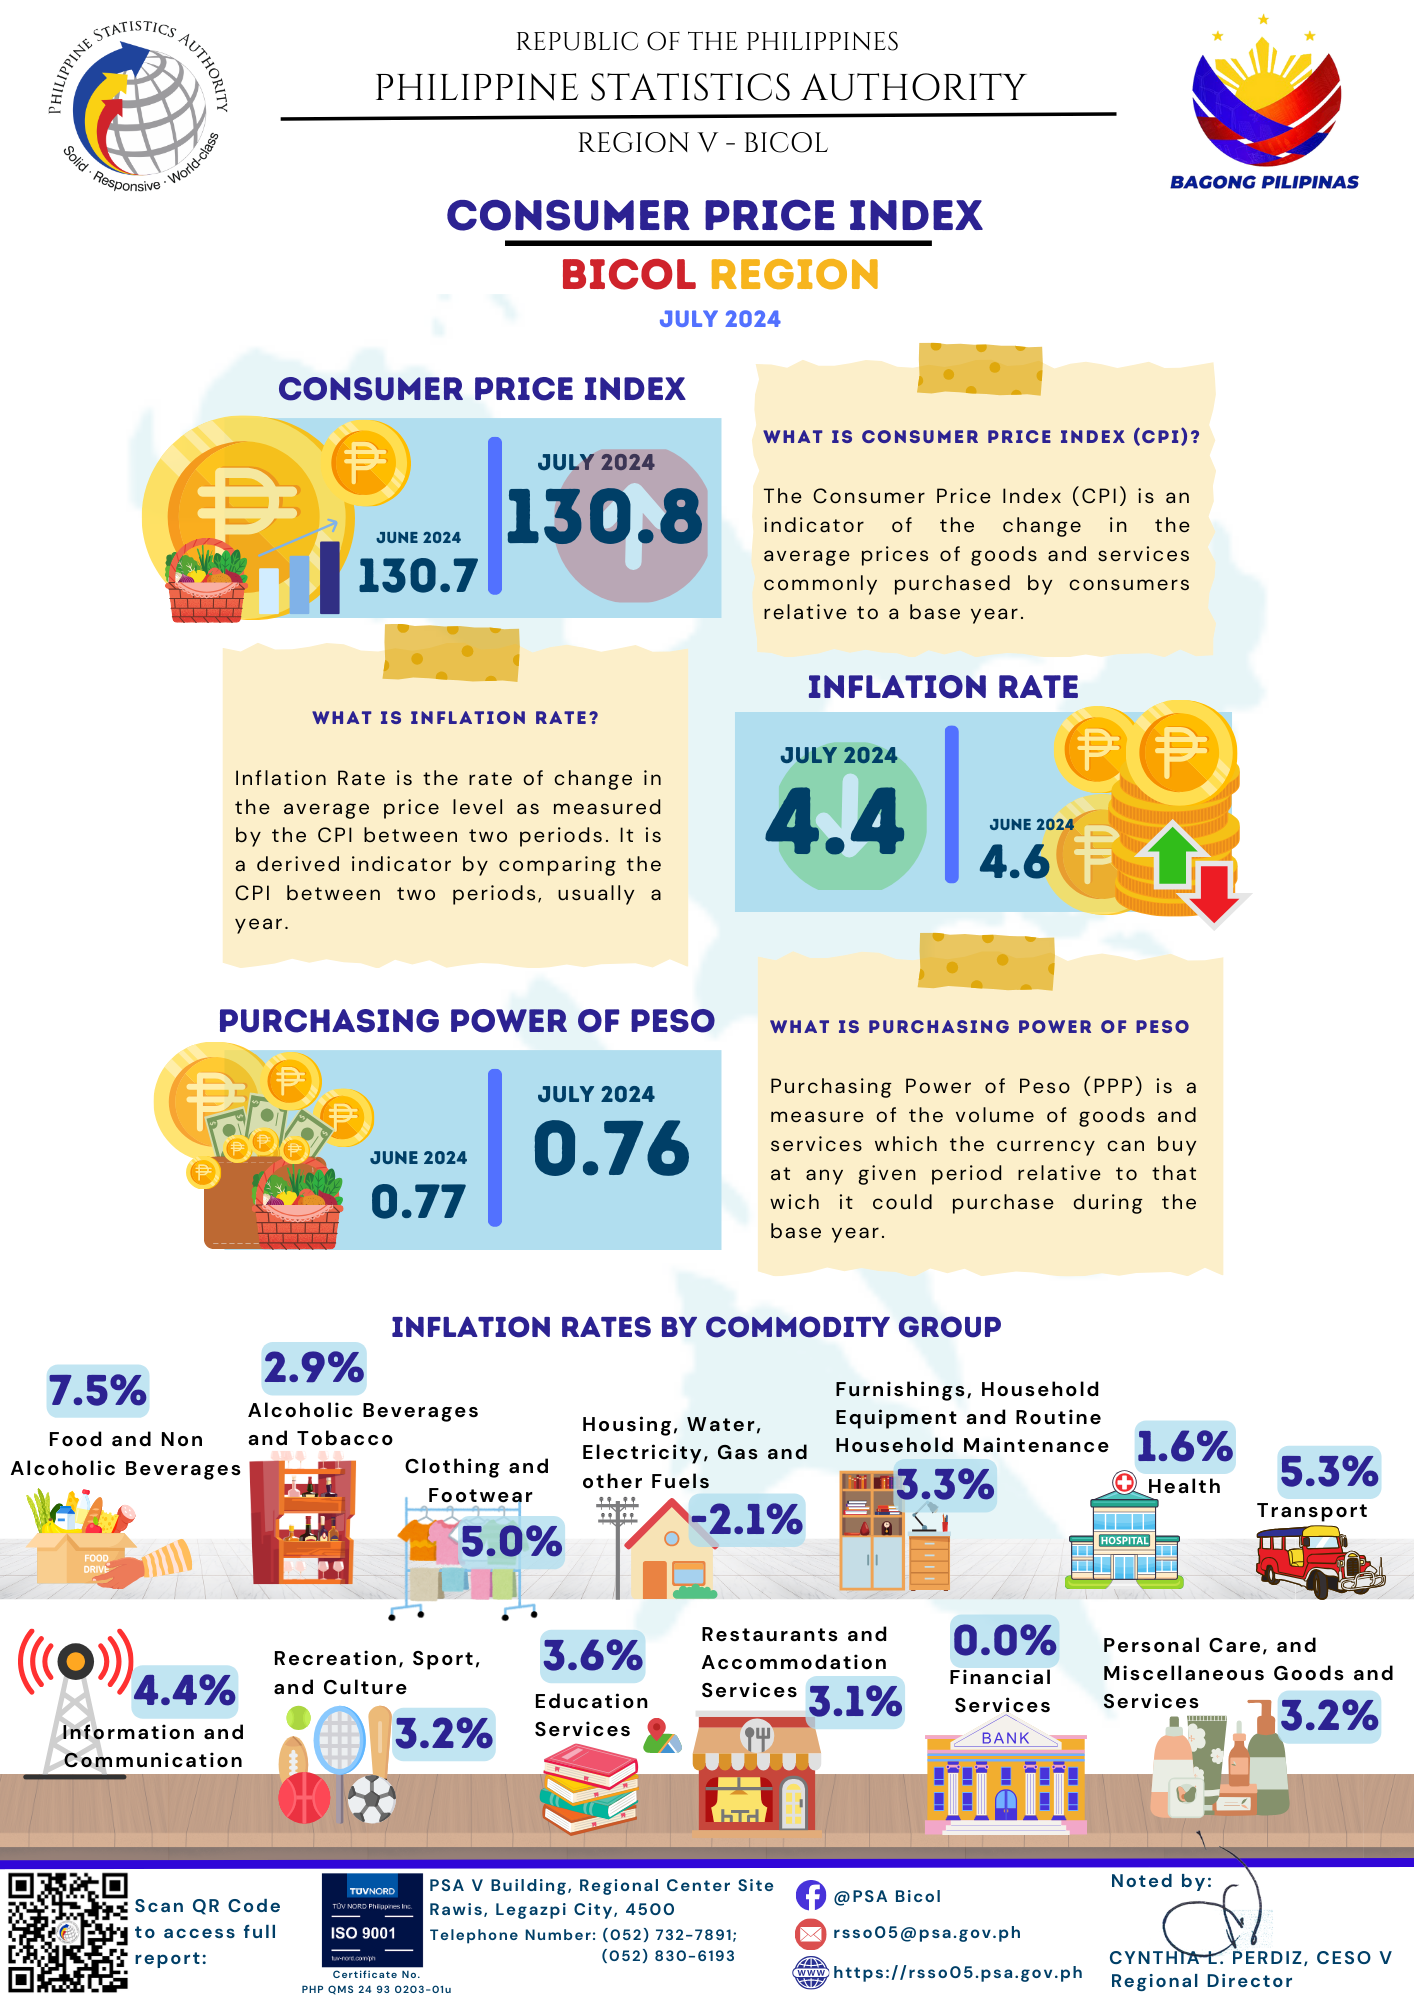
The province’s headline inflation or overall inflation accelerated to 5.6 percent in July 2024 from 5.0 percent in June 2024. This brings the provincial average inflation from January to July 2024 to 4.9 percent. In July 2023, inflation rate was lower at 3.4 percent.
Main Drivers to the Upward Trend of the Headline Inflation
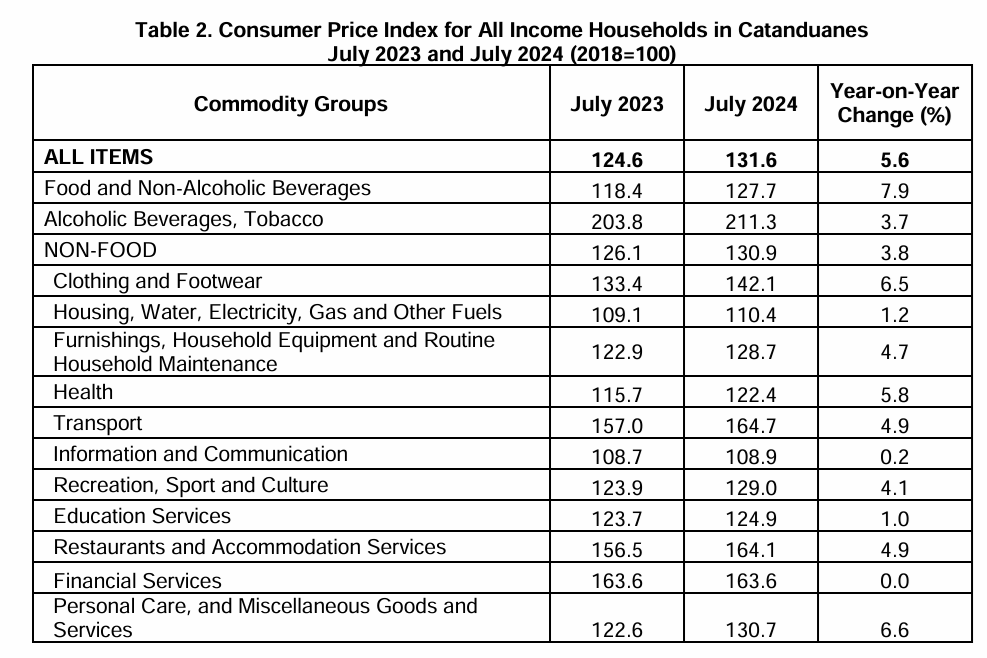
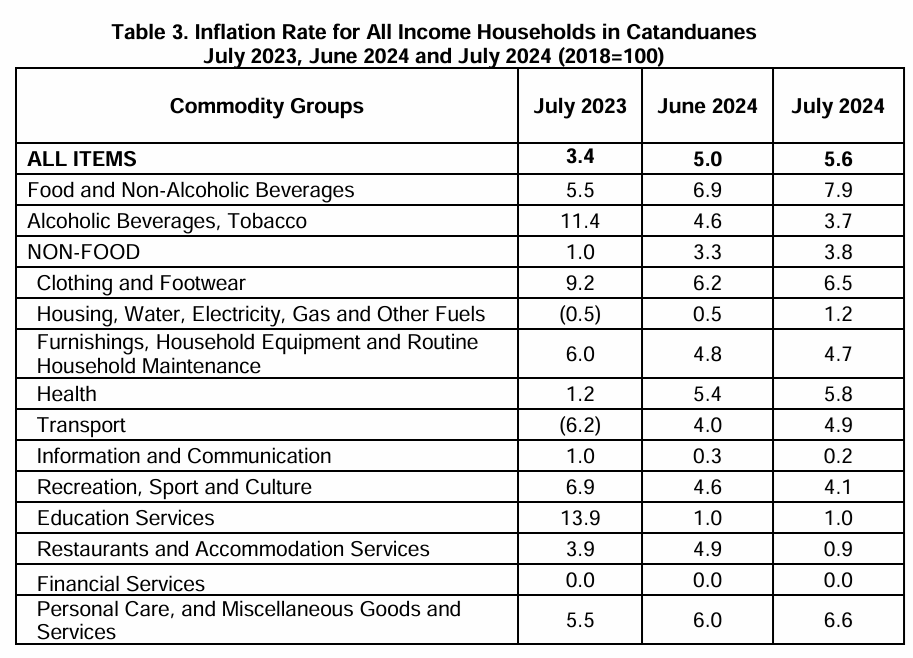
The uptrend in the overall inflation in July 2024 was primarily influenced by the increase in the index of Food and Non-alcoholic Beverages at 7.9 percent during the month from 6.9 percent in June 2024. Also contributing to the uptrend were the faster annual increases in the indices of Housing, Water, Electricity, Gas and Other Fuels with 1.2 percent in July 2024 from 0.5 percent in June 2024, and Transport services with 4.9 percent inflation in July 2024 from 4.0 percent inflation in the previous month.
Moreover, higher inflation rates during the month were also noted in the indices of the following commodity groups during the month:
a. Personal Care, and Miscellaneous Goods and Services, 6.6 percent from 6.0 percent in June 2024;
b. Health, 5.8 percent from 5.4 percent; and
c. Clothing and Footwear, 6.5 percent from 6.2 percent.
In contrast, the following commodity groups registered lower inflation rates during the month:
a. Alcoholic beverages and tobacco, 3.7 percent from 4.6 percent;
b. Furnishings, Household Equipment and Routine Household Maintenance, 4.8 percent from 4.7 percent;
c. Information and Communication, 0.2 percent from 0.3 percent; and
d. Recreation, Sport and Culture, 4.1 percent from 4.6 percent.
The indices of the rest of the commodity groups retained their respective previous month’s annual rates. (Table 3)
Main Contributors to the Headline Inflation
The top three commodity groups contributing to the July 2024 overall inflation were the following:
a. Food and non-alcoholic beverages with 66.0 percent share or 7.9 percentage points;
b. Transport with 6.4 percent share or 4.9 percentage point; and
c. Personal Care, and Miscellaneous Goods and Services with 5.5 percent share or 6.6 percentage point.
Food Inflation
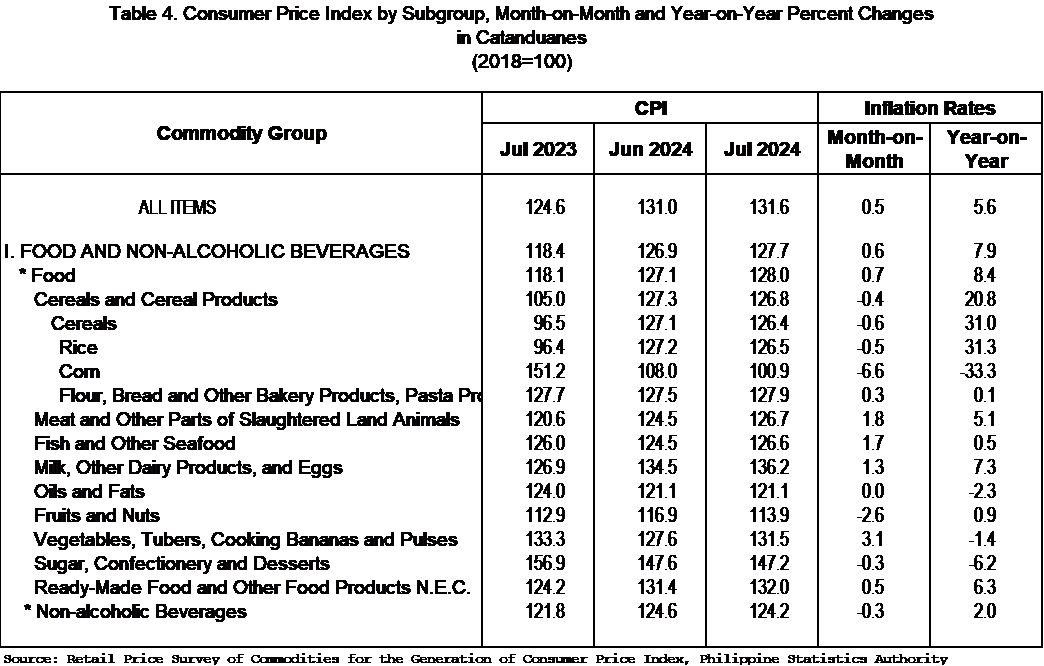
Food inflation at the provincial level rose to 8.4 percent in July 2024 from 7.3 percent in June 2024. In July 2023, food inflation was lower at 5.4 percent.
Main Drivers to the Upward Trend of Food Inflation
The acceleration of food inflation in July 2024 was mainly brought about by the year-on-year increase in meat and other parts of slaughtered land animals index at 5.1 percent in July 2024 from 1.5 percent in the previous month. The index of milk, other dairy products and eggs also contributed to the uptrend with an inflation rate of 7.3 percent during the month from 3.5 percent in June 2024.
In addition, slower annual increase was noted in the indices of rice at 31.3 percent, and fruits and nuts at 0.9 percent in July 2024 from their respective year-on-year decreases of 31.6 percent and 2.3 percent in June 2024.
A slower annual decline was noted in the indices of oils and fats at -2.3 percent in July 2024 from -2.7 in June 2024
On the contrary, an increase in annual growth rates during the month from a decline in June 2024 were observed in the indices of the following food groups:
a. Flour, 0.1 percent from -0.3 percent;
b. Fish, 0.5 percent from -3.3 percent.
An annual decrease in July 2024 from an increase in June 2024 was observed in the indices of vegetables, tubers, plantains, cooking bananas and pulses with -1.4 percent during the month from 4.2 percent in previous month.
Moreover, faster annual decrease of -33.3 percent was observed in the indices of corn from
-28.6 in June 2024 and sugar, confectionary and desserts with -6.2 percent during the month from -6.1 percent in June 2024.
Main contributors to the Food Inflation
Food inflation shared 65.3 percent or 8.4 percentage points to the overall inflation in July 2024.
The top three food groups in terms of contribution to the food inflation during the month were the following:
a. Cereals and cereal products, which includes rice, corn, flour, bread and other bakery products, pasta products, and other cereals, with a share of 37.2 percent or 20.8 percentage points;
b. Meat and other parts of slaughtered land animals with a share of 17.0 percent or 5.1 percentage point; and
c. Fish and other seafood classified with a share of 15.8 percent or 0.5 percentage point.
| Attachment | Size |
|---|---|
|
|
583.36 KB |


")


