
Headline Inflation
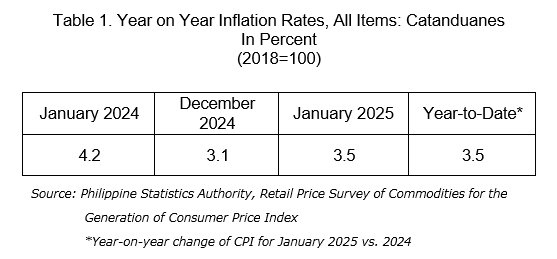
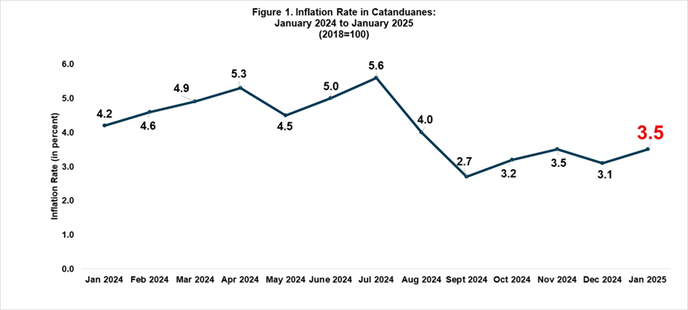
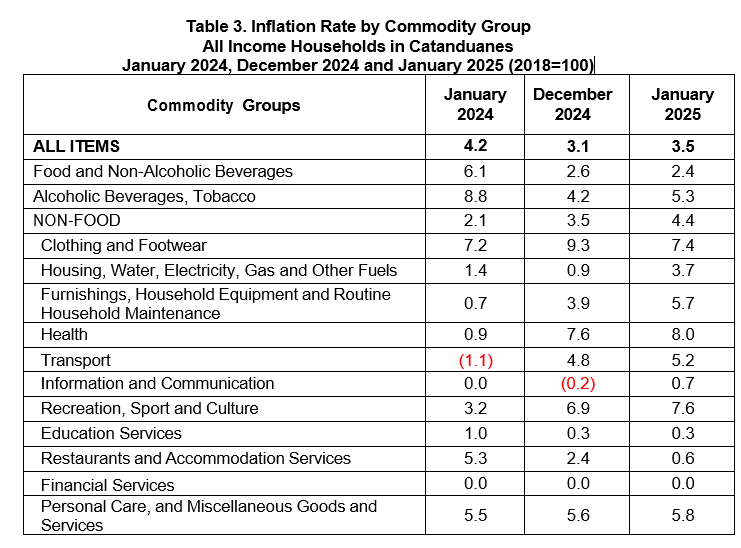
The province’s headline inflation or overall inflation increased to 3.5 percent in January 2025 from 3.1 percent in December 2024. Inflation in January 2024 was posted at 4.2 percent. (Table 1)
Main Drivers to the Upward Trend of the Headline Inflation
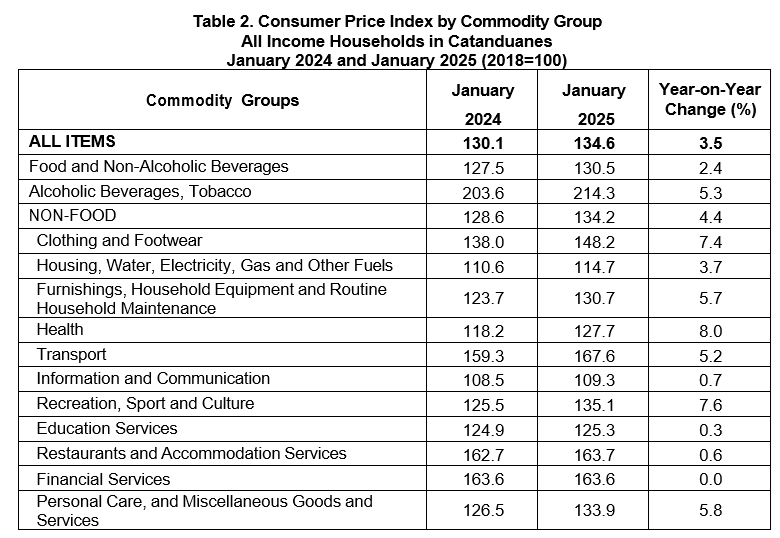
The uptrend in the overall inflation in January 2025 was primarily influenced by the higher annual increment in the index of housing, water, electricity, gas and other fuels at 3.7 percent during the month from 0.9 percent in December 2024. The annual increase of furnishings, household equipment and routine household maintenance at 5.7 percent during the month from 3.9percent in December2024 also contributed to the uptrend. Moreover, higher inflation rates during the month were also noted in the indices of the following commodity groups during the month:
a. Alcoholic, beverages and tobacco, 5.3 percent from 4.2 percent;
b. Transport, 5.2 percent from 4.8 percent;
c. Information and communication, 0.7 percent from -0.2 percent;
d. Health, 8.0 percent from 7.6 percent;
e. Recreation, sport and culture, 7.6 percent from 6.9 percent; and
f. Personal care, and miscellaneous goods and services, 5.8 percent from 5.6 percent.
In contrast, the following commodity groups registered lower inflation rates during the month:
a. Food and non-alcoholic beverages, 2.4 percent from 2.6 percent;
b. Clothing and footwear, 7.4 percent from 9.3 percent; and
c. Restaurants and accommodation services, 0.6 percent from 2.4 percent.
The indices of education and financial services commodity group retained its previous month's annual rates. (Table 3)
Main Contributors to the Headline Inflation
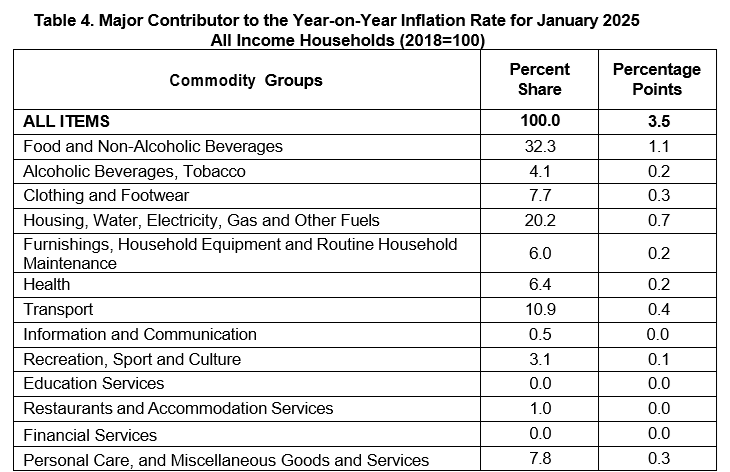
The top three commodity groups contributing to the January 2025 overall inflation were the following:
- Food and non-alcoholic beverages with 32.3 percent share or 1.1 percentage points;
- Housing, water, electricity, gas and other fuels with 20.2 percent share or 0.7 percentage point; and
- Transport footwear with 10.9 percent share or 0.4 percentage point.
Food Inflation
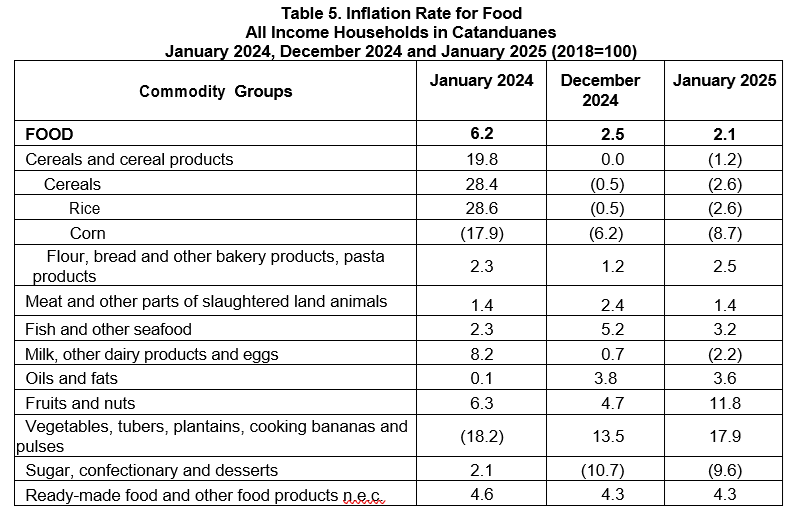
Food inflation at the provincial level decreased to 2.1 percent in January 2025 from 2.5 percent in December 2024. In January 2024, food inflation was higher at 6.2 percent.
Main Drivers to the Downward Trend of Food Inflation
The deceleration of food inflation in January 2025 was mainly brought about by the year-on-year decrease in cereals and cereal products which includes rice, corn, flour, bread and other bakery products, and other cereals at -1.2 percent in January 2025 from 0.0 percent in the previous month. The index of fish and other seafood also contributed to the downtrend with an inflation rate of 3.2 percent during the month from 5.2 percent in December 2024.
Lower inflation rates during the month were also noted in the indices of the following food commodity groups during the month:
a. Milk, other dairy products and eggs, -2.2 percent from 0.7percent;
b. Meat and other parts of slaughtered animals, 1.4 percent from 2.4 percent; and
c. Oils and fats, 3.6 percent from 3.8 percent.
Meanwhile, faster annual increase was noted in the indices of the following:
a. Fruits and nuts, 11.8 percent from 4.7 percent;
b. Vegetables, tubers, plantains, cooking bananas and pulses, 17.9 percent from 13.5 percent; and
c. Sugar, confectionary and desserts, -9.6 percent from -10.7 percent.
The indices of ready-made food and other food products n.e.c food commodity group retained its previous month’s annual rates.
Main Contributors to Food Inflation
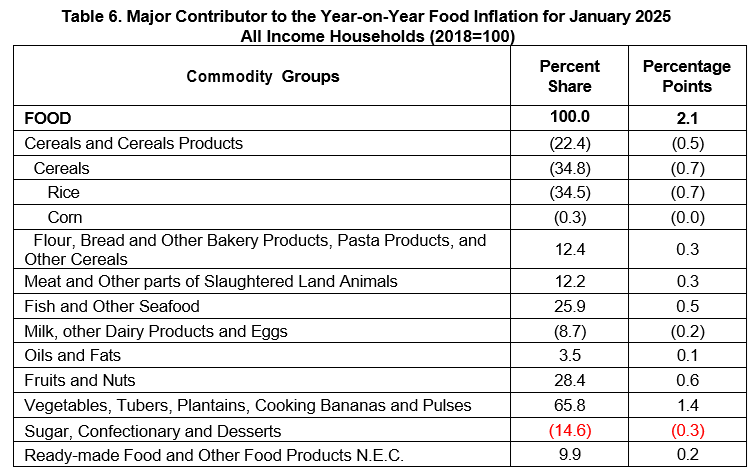
Food inflation shared 27.4 percent or 1.0 percentage points to the overall inflation in January 2025.
The top three food groups in terms of contribution to the food inflation during the month were the following:
a. Vegetables, tubers, plantains, cooking bananas and pulses with a share of 65.8 percent or 1.4 percentage points;
b. Fruits and nuts with a share of 28.4 percent or 0.6 percentage points; and
c. Fish and other seafood with a share of 25.9 percent or 0.5 percentage point.


")