
Release Date :
Reference Number :
2024-082
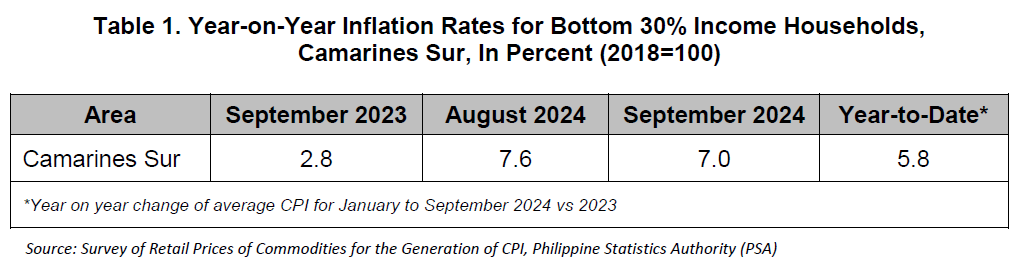
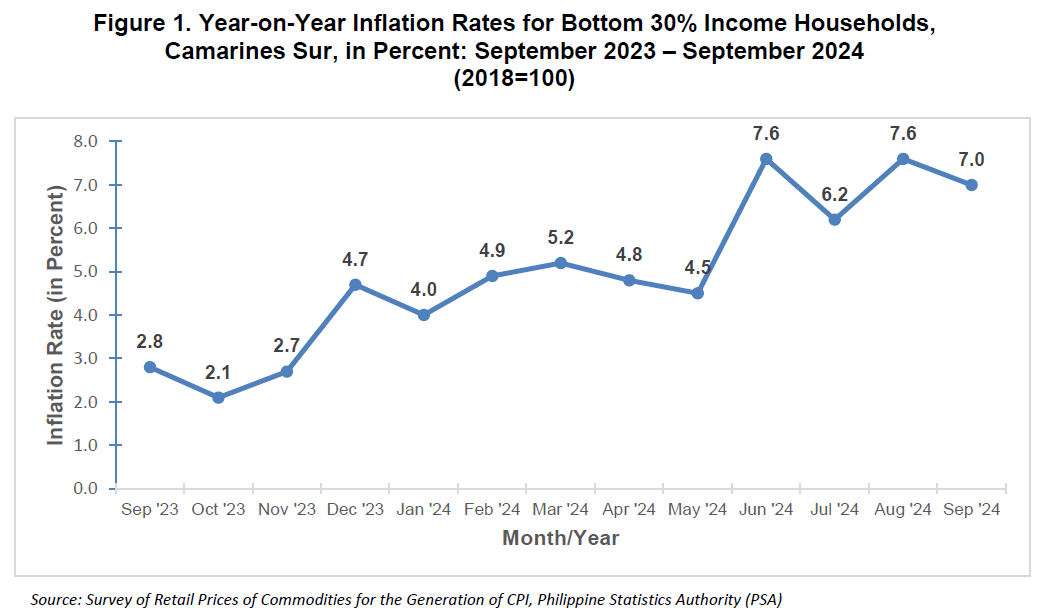
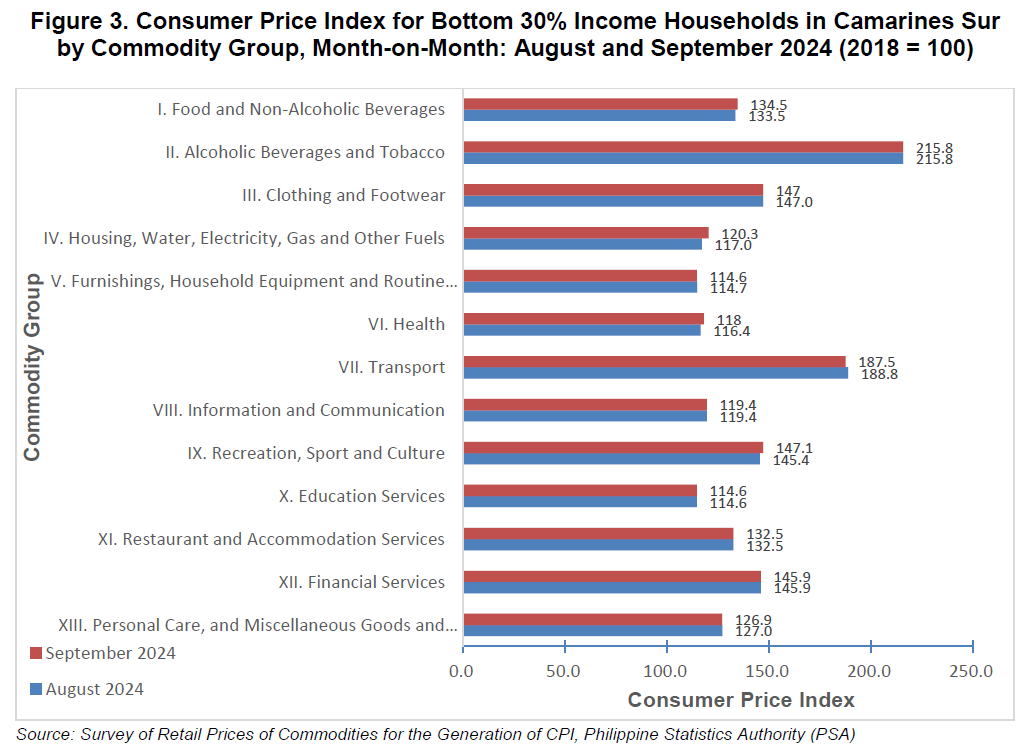
The headline inflation for Bottom 30% Income Households in Camarines Sur decreased to 7.0 percent in September 2024 from 7.6 percent recorded in August 2024. This brings the provincial average inflation from January to September 2024 at 5.8 percent. In addition, September 2023 inflation was lower by 4.2 percentage points compared to September 2024 inflation.
I. Main Contributors to the Year-on-Year Inflation
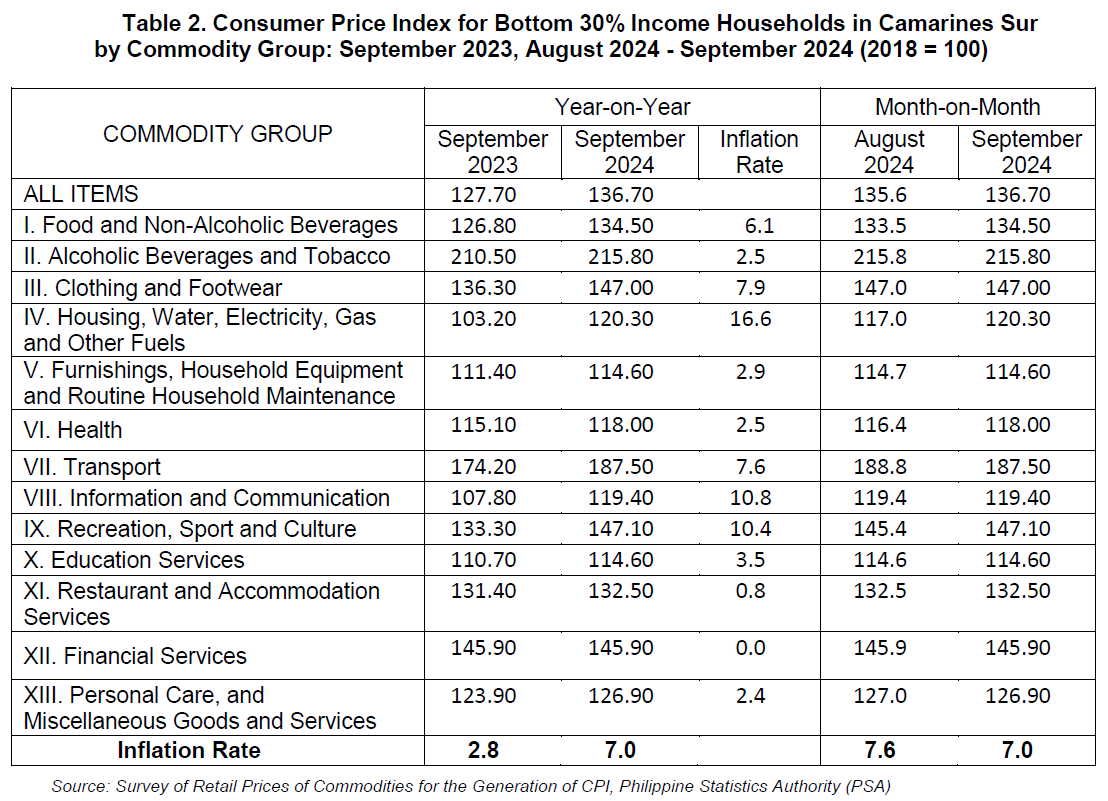
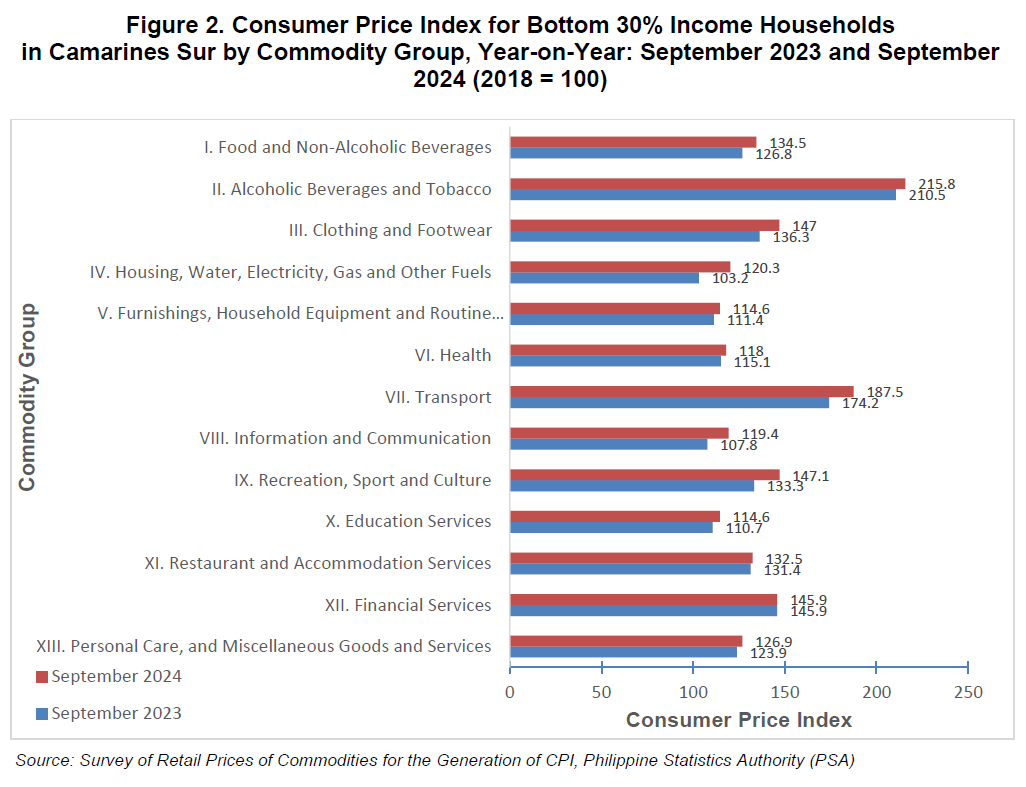
The main contributor to the inflation for Bottom 30% Income Households in Camarines Sur during September 2024 was Food and Non-alcoholic Beverages. This commodity group registered a 47.7 percent share or 3.34 points contribution to September 2024 Inflation.
Housing, Water, Electricity, Gas and Other Fuels was the second contributor to the Camarines Sur’s inflation rate with a 37.1 percent share or 2.6 points, while the third primary contributor was Transport with a 6.0 percent share or 0.42 points.
II. Main Drivers to the Downtrend of the Year-on-Year Inflation
The downtrend in the overall inflation for Bottom 30% Income Households for September 2024 was primary influenced by the lower inflation rate in Food and Non-alcoholic Beverages at 6.1 percent from 8.4 percent in the previous month. Rice recorded 18.8 percent inflation from 25.1 percent in August 2024.
Moreover, lower inflation rates were also noted in the following indices:
1. Furnishings, Household Equipment and Routine Household Maintenance, 2.9 percent;
2. Information and Communication, 10.8 percent.
3. Recreation, Sport and Culture, 10.4 percent;
4. Education Services, 3.5 percent;
5. Restaurant and Accommodation Services, 0.8 percent; and
6. Personal Care, and Miscellaneous Goods and Services, 2.4 percent.
On the other hand, the following commodity groups registered higher inflation rates during the month: Housing, Water, Electricity, Gas and Other Fuels Health, 16.6 percent; and Health, 2.5 percent.
Meanwhile, Alcoholic Beverages and Tobacco, and Clothing and Footwear, and retained its previous month’s inflation rate, while Financial Services recorded zero percent annual growth.

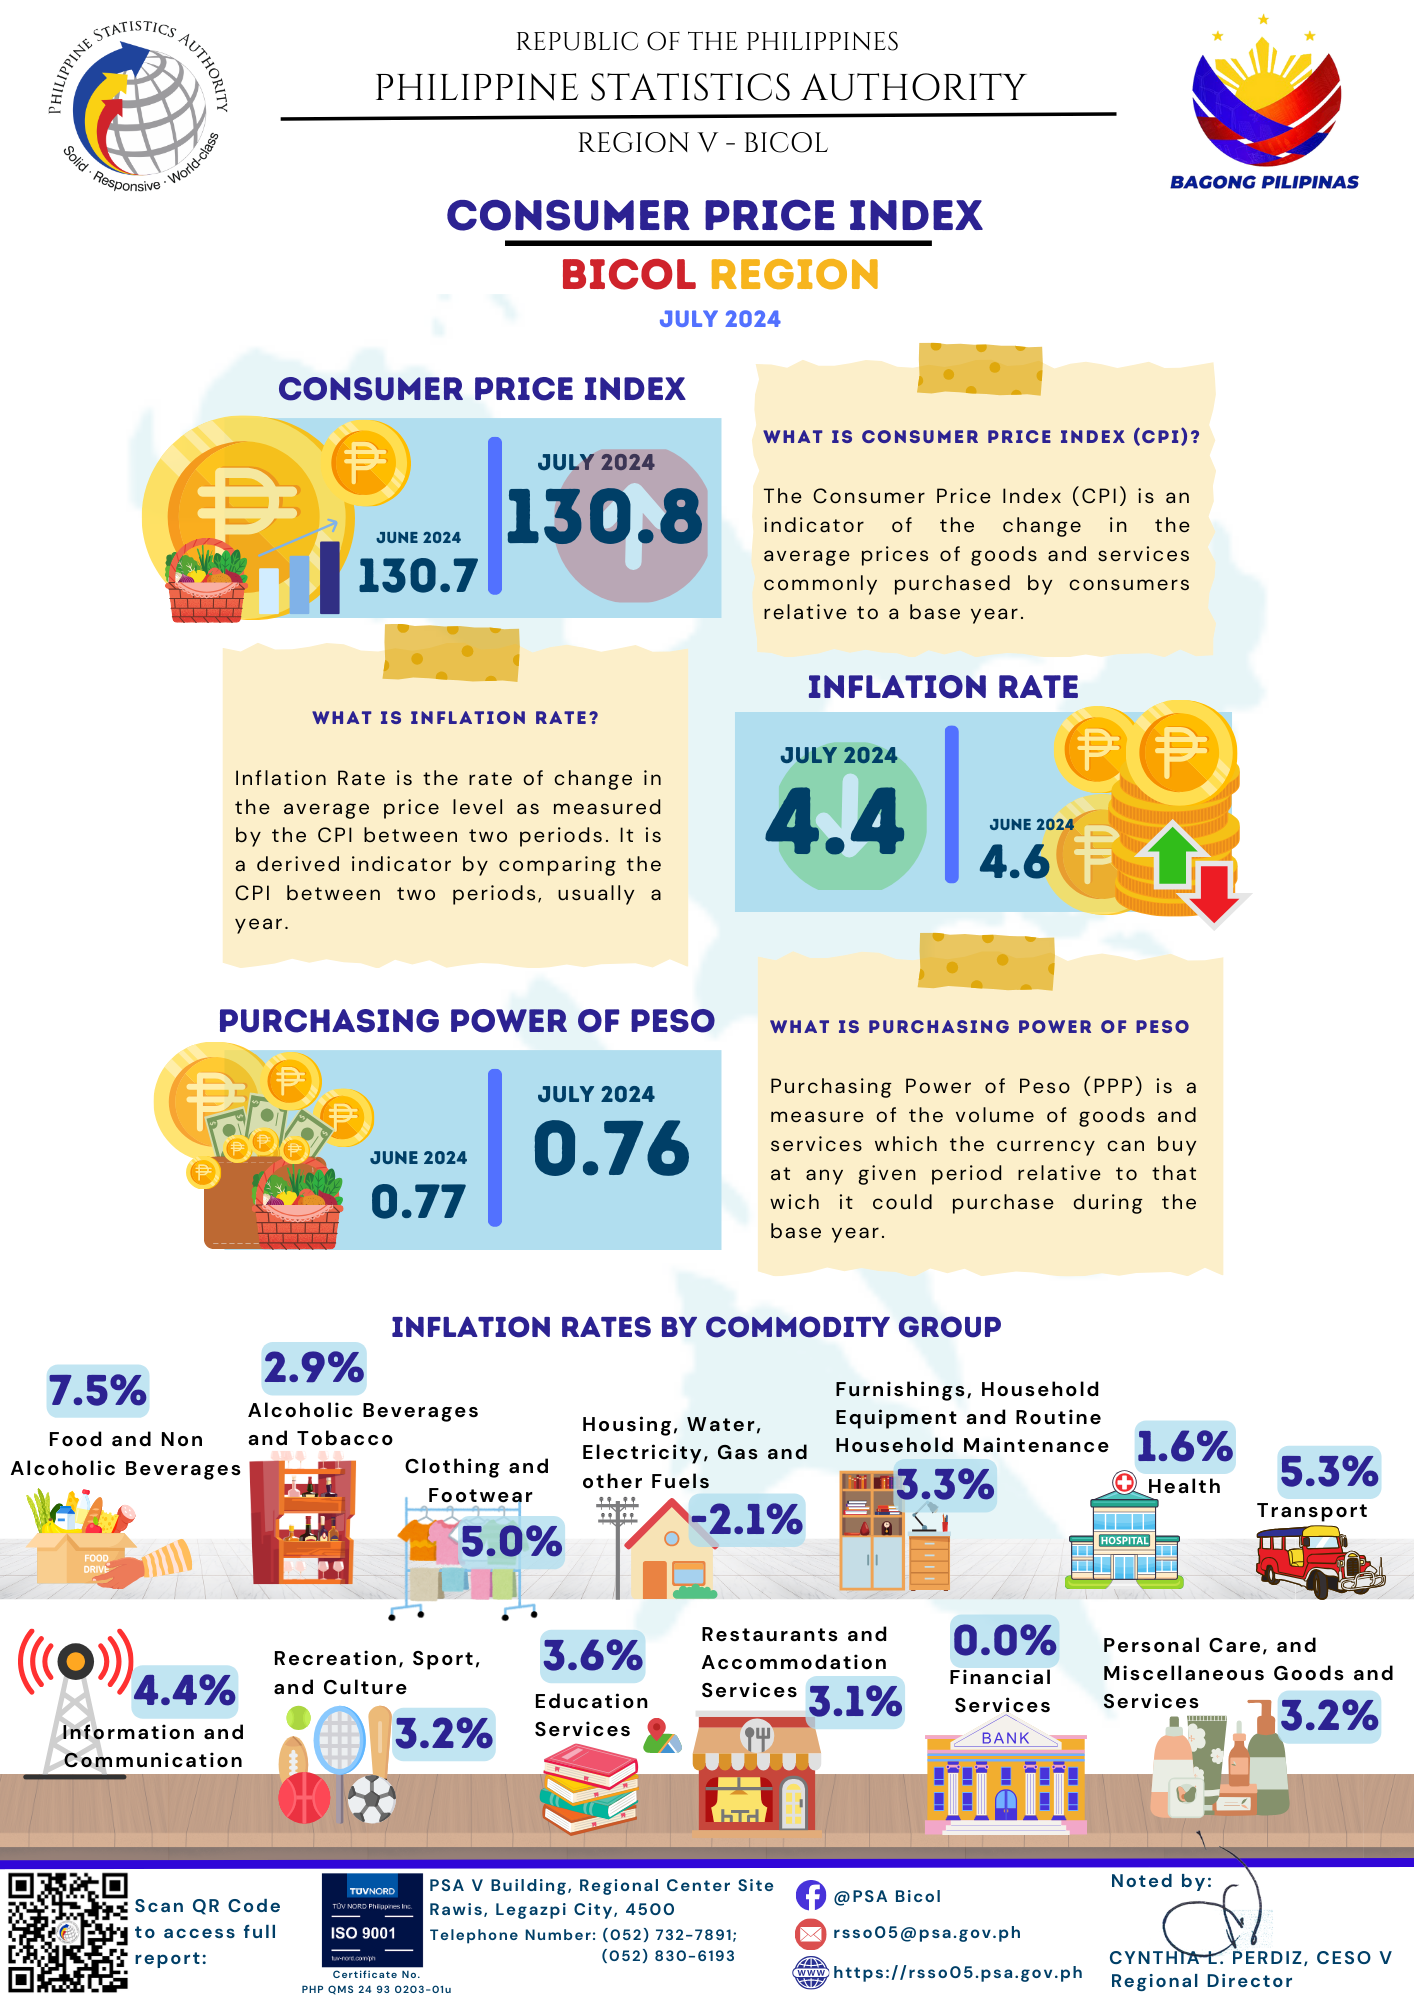
CONSUMER PRICE INDEX (CPI)
The CPI is a measure of the changes in the average price of a fixed basket of goods and services commonly purchased by an average Filipino household. It shows how much on the average, prices of goods and services have increased or decreased from a particular reference period known as base year.
COMPONENTS OF CPI:
A. Base Period
The reference date or base period is the benchmark or reference date or period at which the index is taken as equal to 100. Starting March 2022, the base period is 2018.
B. Market Basket
A sample of the thousands of varieties of goods purchased for consumption and services availed by the households in the country selected to represent the composite price behaviour of all goods and services purchased by consumers.
C. Weighting System
The weighting pattern uses the expenditures on various consumer items purchased byhouseholds as proportion to total expenditure.
D. Formula
The formula used in computing the CPI is the weighted arithmetic mean of price relatives, the Laspeyre’s formula with a fixed base year period (2018) weights.
E. Geographic Coverage
CPI values are computed at the national, regional, and provincial levels, and for selected cities.
INFLATION RATE
The inflation rate is the annual or monthly rate of change of the CPI expressed in percent. Inflation is interpreted in terms of declining purchasing power of money.
HEADLINE INFLATION RATE
The headline inflation rate refers to the rate of change in the CPI, a measure of the average standard “basket” of goods and services consumed by a typical family. It refers to the annual rate of change or the year-on-year change in the CPI.
For example, the percentage change of CPI between September 2023 and September 2024.
MONTH-ON-MONTH INFLATION RATE
Month-On-Month Inflation Rate is the monthly percentage change of CPI. For example, the percentage changes of CPI between September 2024 and August 2024.
CPI FOR THE BOTTOM 30% INCOME HOUSEHOLDS
The CPI for bottom 30% income households is an indicator of the change in the average prices of goods and services commonly purchased by consumers whose per capita income fall below the bottom 30%.
The estimated weights of 2018-based CPI for bottom 30% income households were based from the results of the 2018 Family Income and Expenditure Survey (FIES) for bottom 30% income households.
| Attachment | Size |
|---|---|
|
|
323.87 KB |


")
")
")


")
 2015-2022, Bicol Region")
, 2022 Bicol Region")


")


