
Release Date :
Reference Number :
2024 – 0012
Source: Retail Price Survey of Commodities for the Generation of Consumer Price Index Philippine Statistics Authority
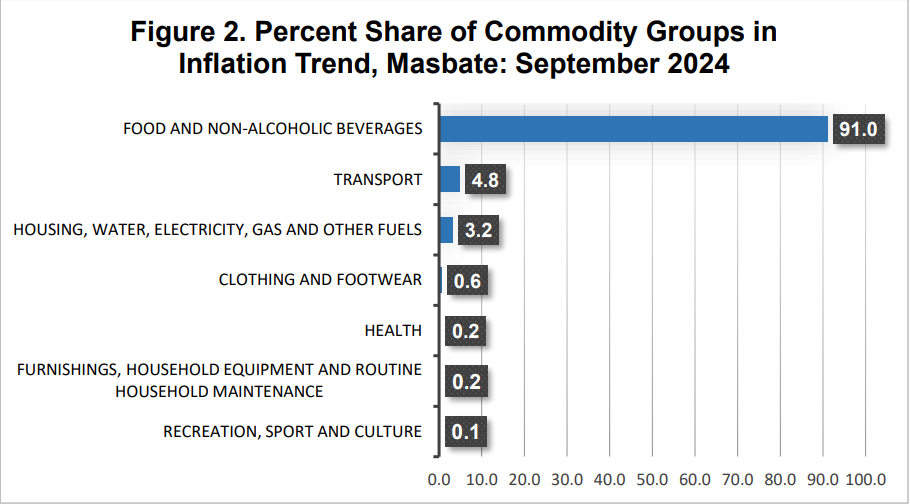
This month, the heavily weighted Food and Non-Alcoholic Beverages commodity group index dropped from 6.7 percent to 3.1 percent. Consequently, it has been the primary factor responsible to the year-on-year decrease of Masbate’s IR. Transport showed an overall decrease from 2.4 percent in August 2024 to 0.9 percent, while the Housing, Water, Electricity, Gas and Other Fuels commodity group index declined as well, falling to 5.5 percent this month from 6.0 percent. (See Figure 2)
Moreover, the following commodity groups recorded a year-on-year decline this September 2024:
a. Clothing and Footwear, 2.0 percent;
b. Furnishings, Household Equipment and Routine Household Maintenance, 10.6 percent;
c. Health, 0.8 percent;
d. Recreation, Sport and Culture, 11.8 percent; and
e. Education Services, 0.0 percent.
On the other hand, this month showed annual growth in the following commodity groups:
a. Alcoholic Beverages and Tobacco, 7.5 percent; and
b. Personal Care, and Miscellaneous Goods and Services, 5.4 percent.
While the reported year-on-year rate in the following indices remained constant:
a. Information and Communication, 8.6 percent;
b. Restaurants and Accommodation Services, 4.9 percent; and
c. Financial Services, 0.0 percent.
Source: Retail Price Survey of Commodities for the Generation of Consumer Price Index Philippine Statistics Authority
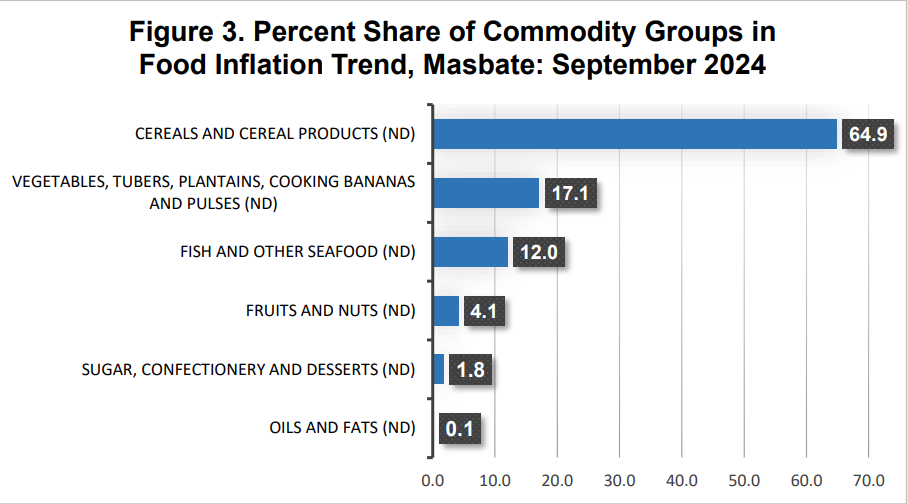
Masbate’s food inflation declined to 10.1 percent.
The provincial rate of food inflation decreased from 6.8 percent last month to 3.0 percent this September 2024. The annual decrease rate of cereals and cereal products (including rice and corn) from 16.6 percent to 10.1 percent this month is the primary reason for the downtrend of food inflation. Followed by vegetables, tubers, plantains, cooking bananas and pulses which lowers from 5.1 percent to -6.7 percent, and fish and other seafood which declined from -2.7 percent in August 2024 to -5.3 percent in September 2024. (See Figure 3)
During the reference month, the following commodities likewise displayed reduced yearly growth rates:
a. Oils and fats, -2.6 percent;
b. Fruits and nuts, 0.4 percent; and
c. Sugar, confectionery and desserts, -11.6 percent.
While, the following food items recorded an annual increase during the month:
a. Meat and other parts of slaughtered land animals, 3.6 percent;
b. Milk, other dairy products and eggs, 5.4 percent; and
c. Ready-made food and other food products n.e.c, 11.5 percent.
Source: Retail Price Survey of Commodities for the Generation of Consumer Price Index Philippine Statistics Authority
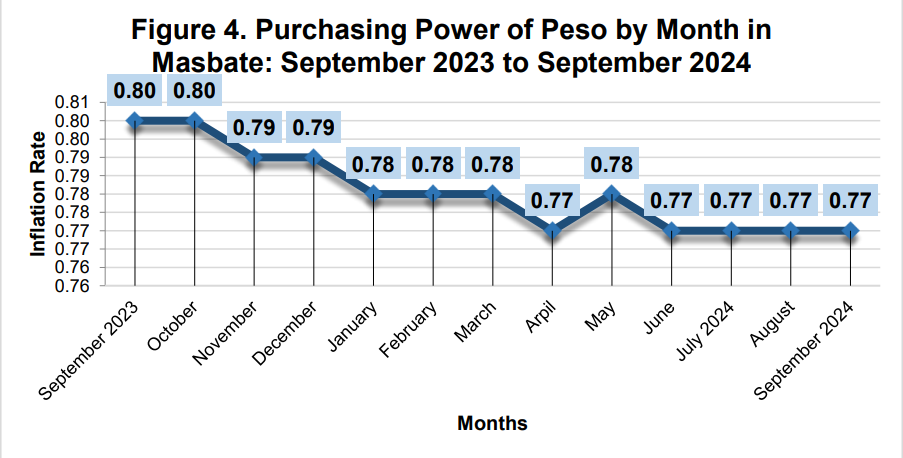
Masbate’s Purchasing Power of Peso (PPP) remained steady at 0.77 despite the minimal changes in the Consumer Price Index (CPI) due to pricing volatility and the inflation rate’s downward trend. (See Figure 4 and Table 1)
Source: Retail Price Survey of Commodities for the Generation of Consumer Price Index Philippine Statistics Authority
| Attachment | Size |
|---|---|
|
|
436.95 KB |


")
")
")


")
 2015-2022, Bicol Region")
, 2022 Bicol Region")


")


