
Release Date :
Reference Number :
2025SR-R541-0003
Masbate’s headline inflation rises to 3.7 percent
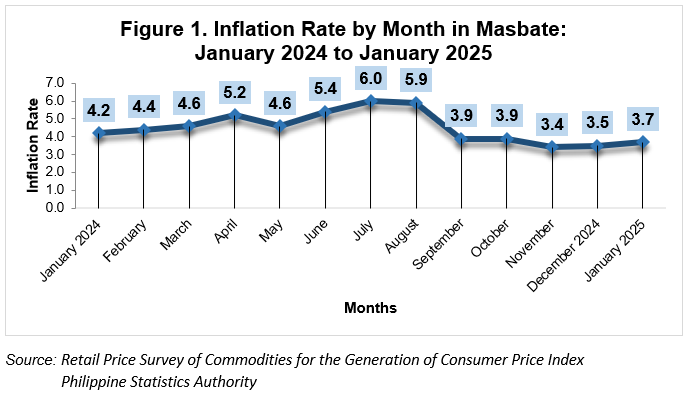
The headline inflation rate in Masbate rose to 3.7 percent in January 2025 from 3.5 percent in December 2024. The highest reported inflation rate 6.0 percent in July 2024. (See Figure 1)
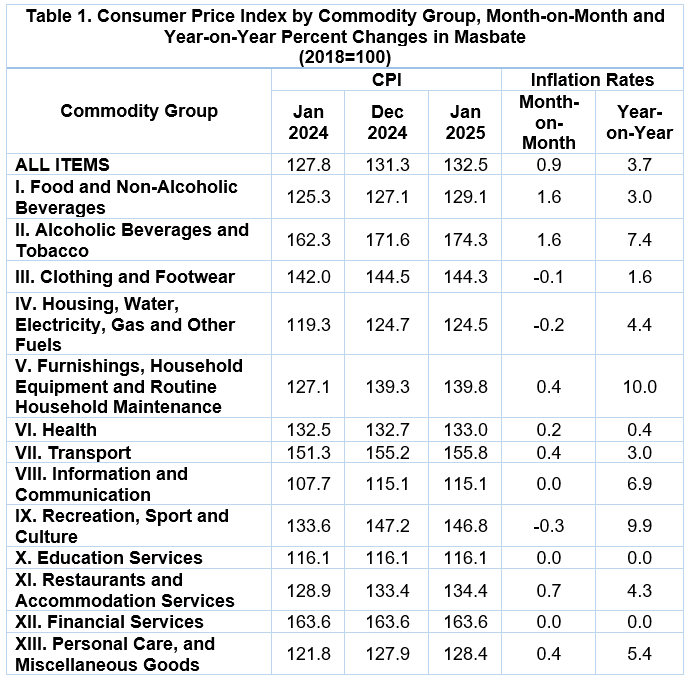
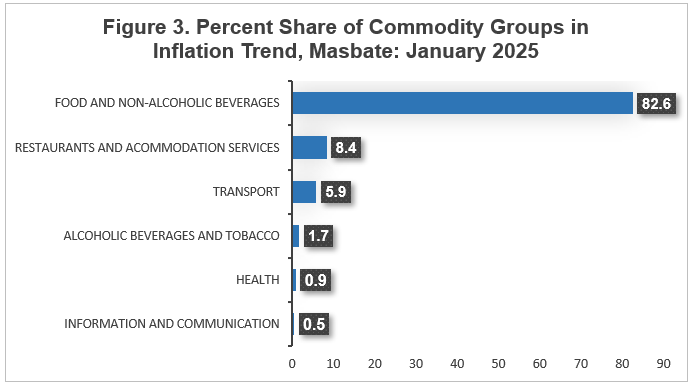
The Food and Non-alcoholic Beverages category leads among commodity service groups, reflecting the highest share to the inflation trend, recorded at 3.0 percent, an increase from 2.3 percent the previous month. Restaurant and Accommodation Services, whose index rose from 3.5 percent in December 2024 to 4.3 percent in January 2025, and Transport whose index increased from 2.6 percent last month to 3.0 percent this month.
In addition, annual increases were observed in the indices of the following commodity groups/services during the month:
a. Alcoholic Beverages and Tobacco, 7.4 percent;
b. Health, 0.4 percent; and
c. Information and Communication, 6.9 percent.
On the other hand, the following commodity groups/services shows annual decreases during the month:
a. Clothing and Footwear, 1.6 percent;
b. Housing, Water, Electricity, Gas and Other Fuels, 4.4 percent;
c. Furnishings, Household Equipment and Routine Household Maintenance, 10.0 percent;
d. Recreation and Culture, 9.9 percent; and
e. Personal Care, and Miscellaneous Goods and Services, 5.4 percent.
While the following commodity groups/services remained its annual rate during the month:
a. Education Services, 0.0 percent; and
b. Financial Services, 0.0 percent.
Provincial food inflation increased to 2.5 percent from 1.8 percent in the previous month. The annual growth rate in Fish and other seafood, which increased from -4.7 percent last month to 4.8 percent in January 2025, was one of the primary factors to the uptrend in food inflation. 4.8 percent from -4.7 percent last month. Vegetables, tubers, plantains, cooking bananas and pulses came in at 7.7 percent this month from -0.1 percent last month, followed by Meat and other parts of slaughtered land animals at 11.5 percent from 9.7 percent.
The following commodities also showed higher annual growth rate in February 2024:
a. Milk, other dairy products and eggs, 3.1 percent;
b. Fruits and nuts, 8.2 percent; and
c. Sugar, confectionery and desserts, -7.5 percent
In contrary, the following food commodities have showed annual deceleration during the month:
a. Cereals and cereal products (including rice and corn), -2.4 percent;
b. Oils and fats, -3.9 percent; and
c. Ready-made food and other food products n.e.c, 12.0 percent.
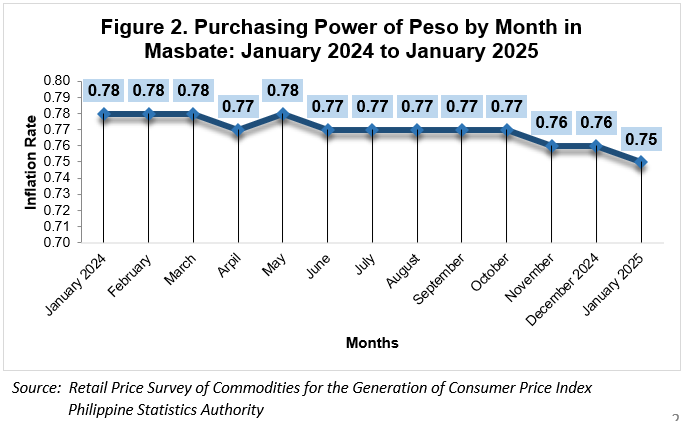
The provincial Purchasing Power of the Peso (PPP) in Masbate decrease at 0.75 as a result of the changes in prices and the ascending trend of the inflation rate with a movement in Consumer Price Index (CPI). (See Table 1 and Figure 2)
| Attachment | Size |
|---|---|
|
|
337.48 KB |


")
")
")


")
 2015-2022, Bicol Region")
, 2022 Bicol Region")


")


