
Release Date :
Reference Number :
2024 – 0008
Source: Retail Price Survey of Commodities for the Generation of Consumer Price Index
Philippine Statistics Authority
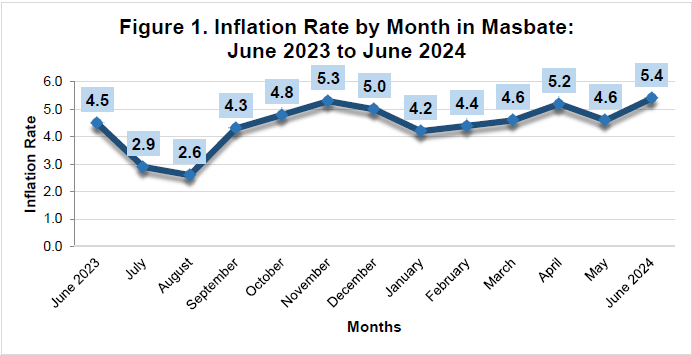
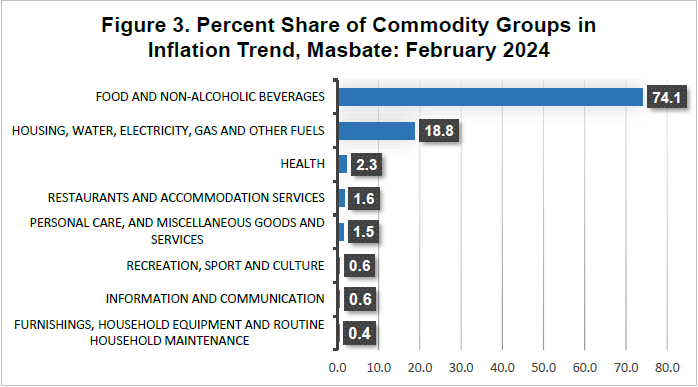
Masbate's inflation trend was primarily driven by a higher year-on-year increase in the index
of the heavily weighted Food and Non-Alcoholic Beverages commodity group, which rose to
6.3 percent this month from 5.1 percent last month. Housing, Water, Electricity, Gas, and
Other Fuels rose to 3.9 percent from 2.7 percent, as did Health, which grew to 1.8 percent in
June 2024 from 0.8 percent in May 2024.
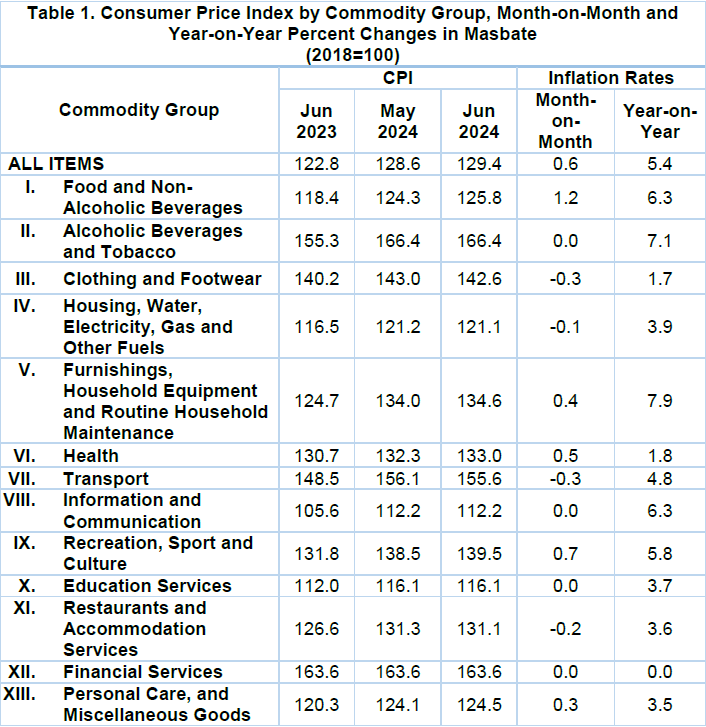
Furthermore, the indexes of the following commodity groups/services showed annual
increases throughout the month:
a. Furnishings, Household Equipment and Routine Household Maintenance, 7.9
percent;
b. Information and Communication, 6.3 percent;
c. Recreation, Sport and Culture, 5.8 percent;
d. Restaurants and Accommodation Services, 3.6 percent; and
e. Personal Cate, and Miscellaneous Goods and Services, 3.5 percent.
On the other side, the following commodity groups/services experienced annual reductions this month:
a. Alcoholic Beverages and Tobacco, 7.1 percent;
b. Clothing and Footwear, 1.7 percent; and
c. Transport, 4.8 percent.
While during the month, the annual rates for the following commodity groups/services remained unchanged:
a. Education Services, 3.7 percent; and
b. Financial Services, 0.0 percent.
Provincial food inflation increased to 6.3 percent this month of June from 5.1 percent the month before. The primary factors contributing to the June 2024 food inflation uptick were the yearly growth rate of Cereals and cereal goods (which comprises rice and corn), which increased to 20.1 percent from 18.6 percent the previous month. Then came Vegetables, tubers, plantains, cooking bananas, and legumes which grew to 2.9 percent from -2.7 percent, and Fruits and nuts, which increased to 8.2 percent this month from 1.4 percent the month before.
During the reference month, the following commodities also displayed increased yearly growth rates:
a. Meat and other parts of slaughtered land animals, -1.0 percent;
b. Milk, other dairy products and eggs, 1.6 percent; and
c. Ready-made food and other food products n.e.c, 9.3 percent.
On the other hand, throughout the month, the following food items displayed a yearly slowdown:
a. Fish and other seafood, -6.5 percent;
b. Oils and fats, -5.8 percent; and
c. Sugar, confectionery and desserts, -6.9 percent.
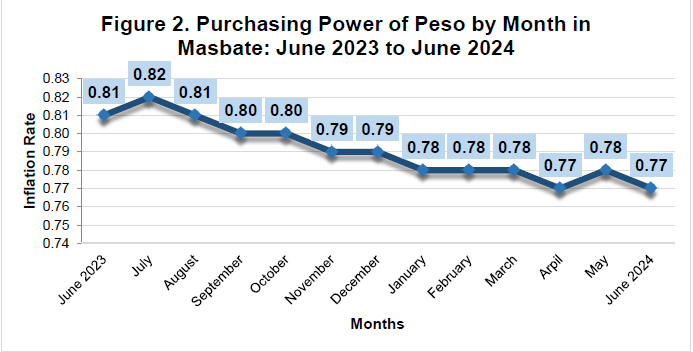
Due to price fluctuations and the rising tendency of the inflation rate, the provincial Purchasing Power of the Peso (PPP) in Masbate decreased to 0.77 with little movement in the Consumer Price Index (CPI). (See Table 1 and Figure 2)
Source: Retail Price Survey of Commodities for the Generation of Consumer Price Index Philippine Statistics Authority.


")
")
")


")
 2015-2022, Bicol Region")
, 2022 Bicol Region")


")


