
Release Date :
Reference Number :
25ID-PSO62-15
1. The Headline Inflation
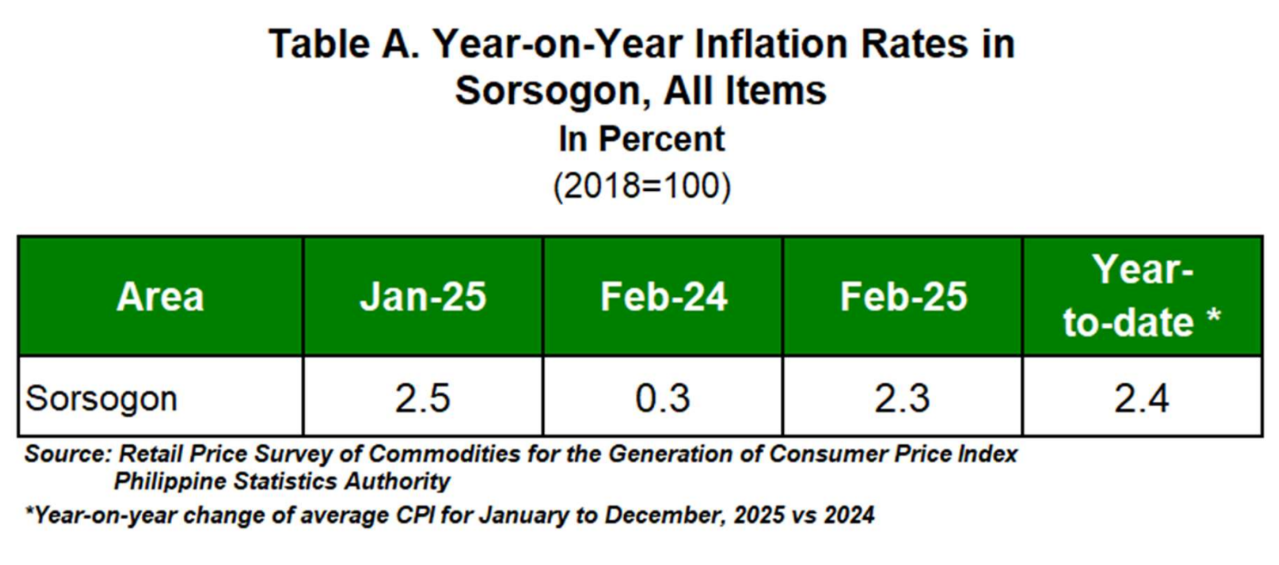
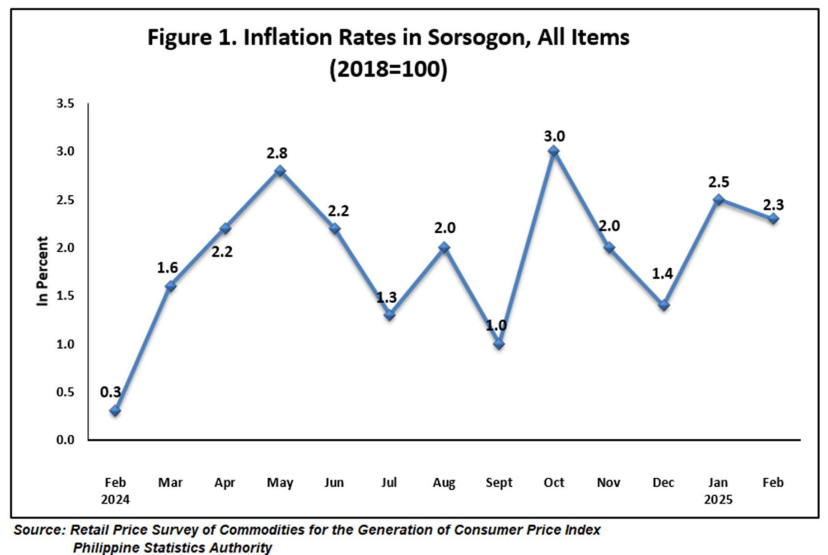
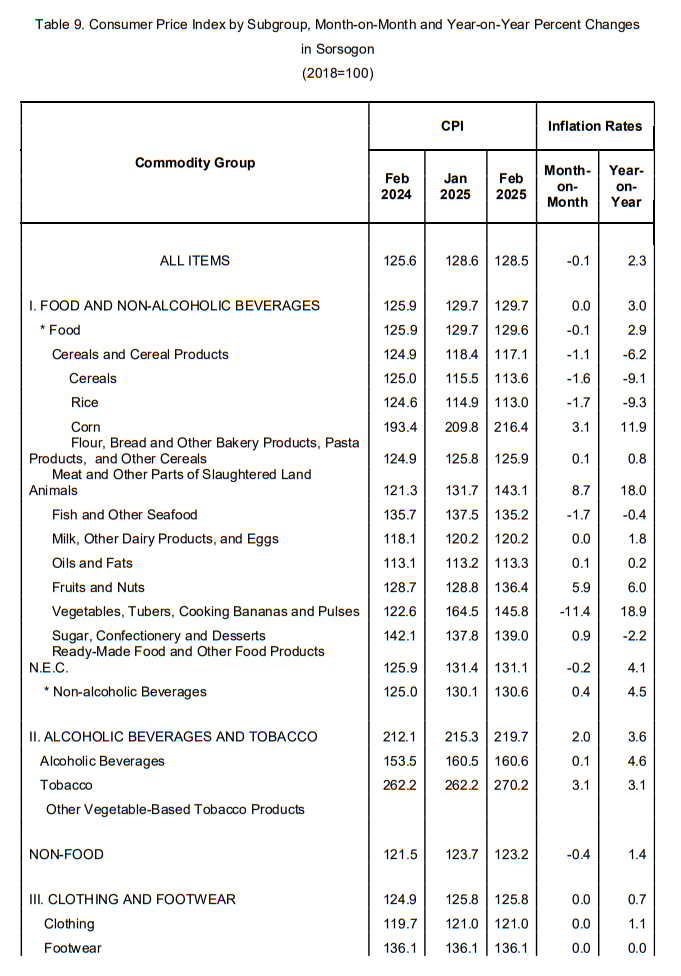
Inflation in the province of Sorsogon moved slower to 2.3 percent in February 2025, from 2.5 percent in the previous month. In 2024 of the same month, inflation was posted at 0.3 percent. This brings the provincial average inflation rate from January to December 2025 at 2.7 percent. (Table 1 and Figure 1)
1.1. Main Driver to the Downward Trend
The downward trend in the inflation was due to the slower increases in the indices of the following commodity groups:
- Food and Non-alcoholic beverages with 1.8 percent;
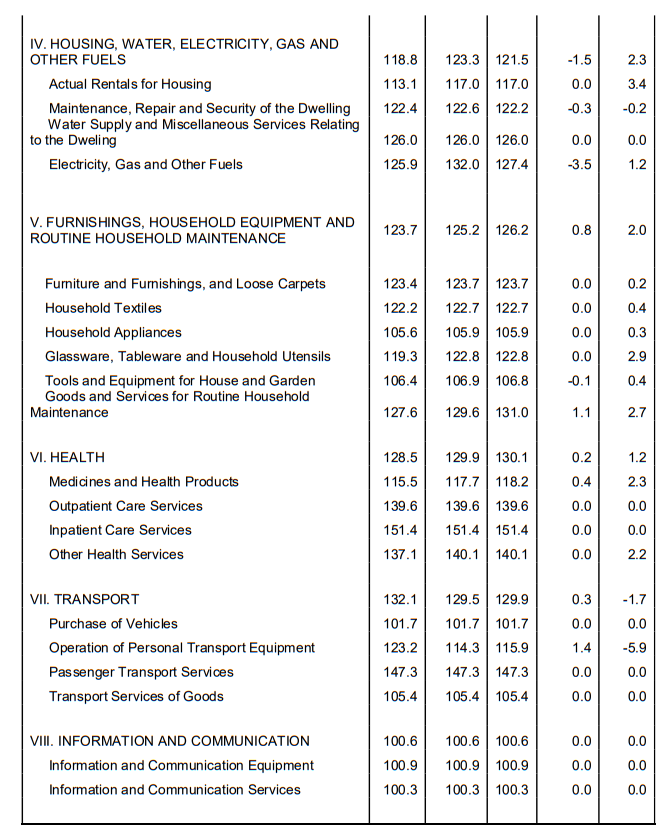
- Housing, water, electricity, gas and other fuels with 2.0 percent;
- Restaurants and accommodation services with 0.7;
- Transport with -1.5 percent;
- Personal care and miscellaneous goods and services with 2.5 percent; and
- Clothing and footwear with 0.6 percent.
1.2. Main Contributor to Headline Inflation
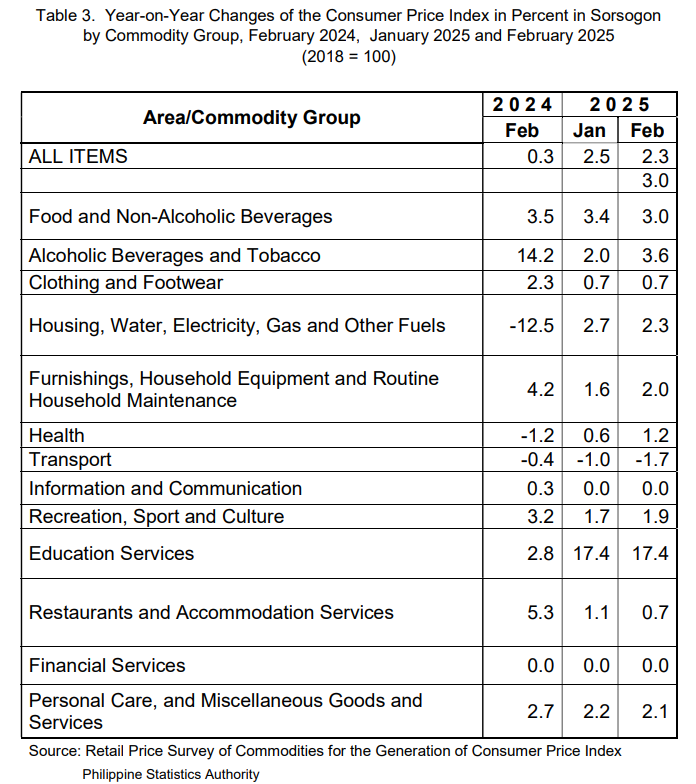
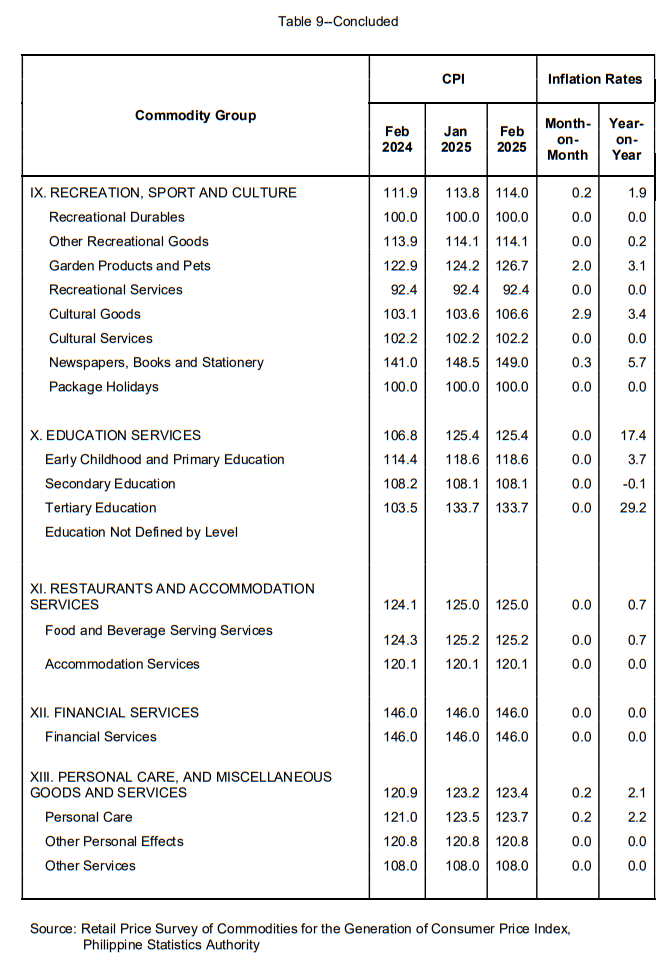
The main contributor to Sorsogon’s overall inflation was the Food and Non-alcoholic Beverages with an inflation rate of 3.0 percent. This translates to 63.0 percent share or 1.45 percentage points to the province’s inflation. The second contributor was Housing, water, electricity, gas and other fuels with 2.3 percent inflation rate which translates to 17.7 percent share or 0.41 percentage point share. This was followed by Education services and Personal care and miscellaneous goods and services with 8.2 and 4.3 percent share or 0.19 and 0.10 percentage points share respectively.
2. Food Inflation
Food inflation in the province moved slower at 2.9 percent from 3.4 percent on previous month. In the same month of the previous year, food inflation was noted at 3.5 percent.
2.1. Main Driver to the Upward trend of Food Inflation
Lower annual growth rates of the indices were seen in the following commodity groups:
- Cereals and cereal products, -6.2 percent;
- Vegetables, tubers, plantains, cooking bananas and pulses, 18.9 percent;
- Milk, other dairy products and eggs, 1.8 percent; and
- Ready-made food and other food products n.e.c, 4.1 percent.
2.2. Main Contribution to the Food Inflation
Food inflation contributed 58.0 percent or 1.33 percentage points to the overall inflation in February 2025. Listed below are top five contributors to February 2025 Food inflation along with its percent share and percentage share:
- Meat and other parts of slaughtered land animals, 101.3 percent share or 2.94 percentage points;
- Vegetables, tubers, plantains, cooking bananas and pulses, 52.6 percent share or 1.53 percentage points;
- Fruits and nuts, 10.0 percent share or 0.29 percentage points;
- Ready-made food and other food products n.e.c, 6.0 percent share or 0.17 percentage points; and
- Milk, other dairy products and eggs, 4.7 percent share or 0.14 percentage points.
Meanwhile, Cereals and cereal products contributed -70.2 percent to the total food inflation which translated to negative 2.04 percentage points to the total food inflation.
Purchasing Power of the Peso
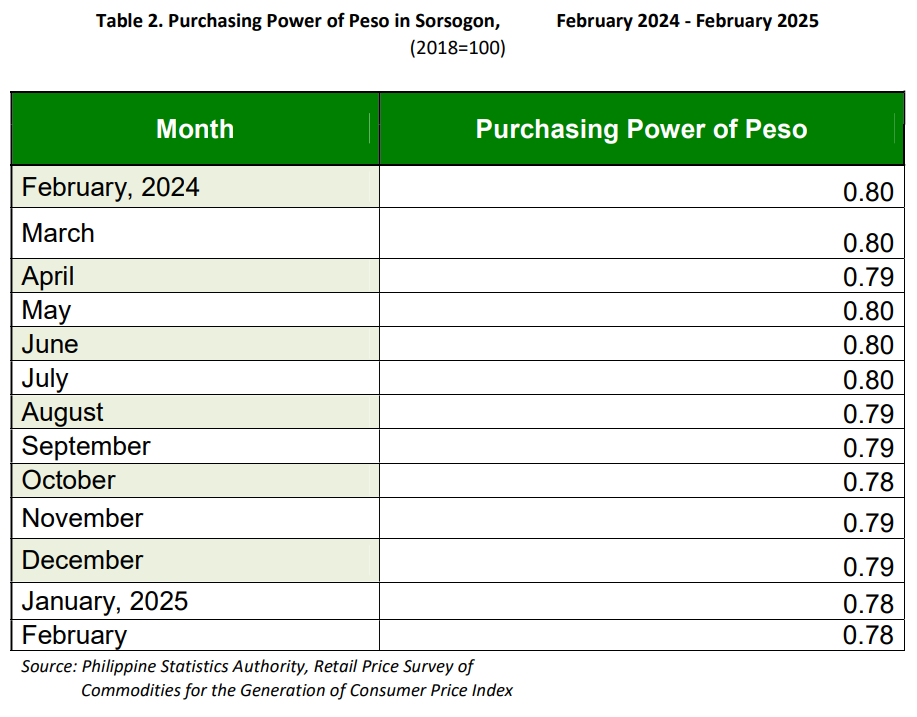
The purchasing power of peso (PPP) in the province of Sorsogon was at 0.78 pesos this month. This means that a peso in 2018 is worth 78 centavos in February 2025. The PPP last month and a year ago was at 0.80 pesos. (Refer to Table 2)

COMPONENTS OF CPI:
A. Base Period
The reference date or base period is the benchmark or reference date or period at which the index is taken as equal to 100. Starting February 2022, the base period is 2018.
B. Market Basket
A sample of the thousands of varieties of goods purchased for consumption and services availed by the households in the country selected to represent the composite price behavior of all goods and services purchased by consumers.
C. Weighting System
The weighting pattern uses the expenditures on various consumer items purchased by households as proportion to total expenditure.
D. Formula
The formula used in computing the CPI is the weighted arithmetic mean of price relatives, the Laspeyre’s formula with a fixed base year period (2018) weights.
E. Geographic Coverage
CPI values are computed at the national, regional, and provincial levels, and for selected cities.
INFLATION RATE
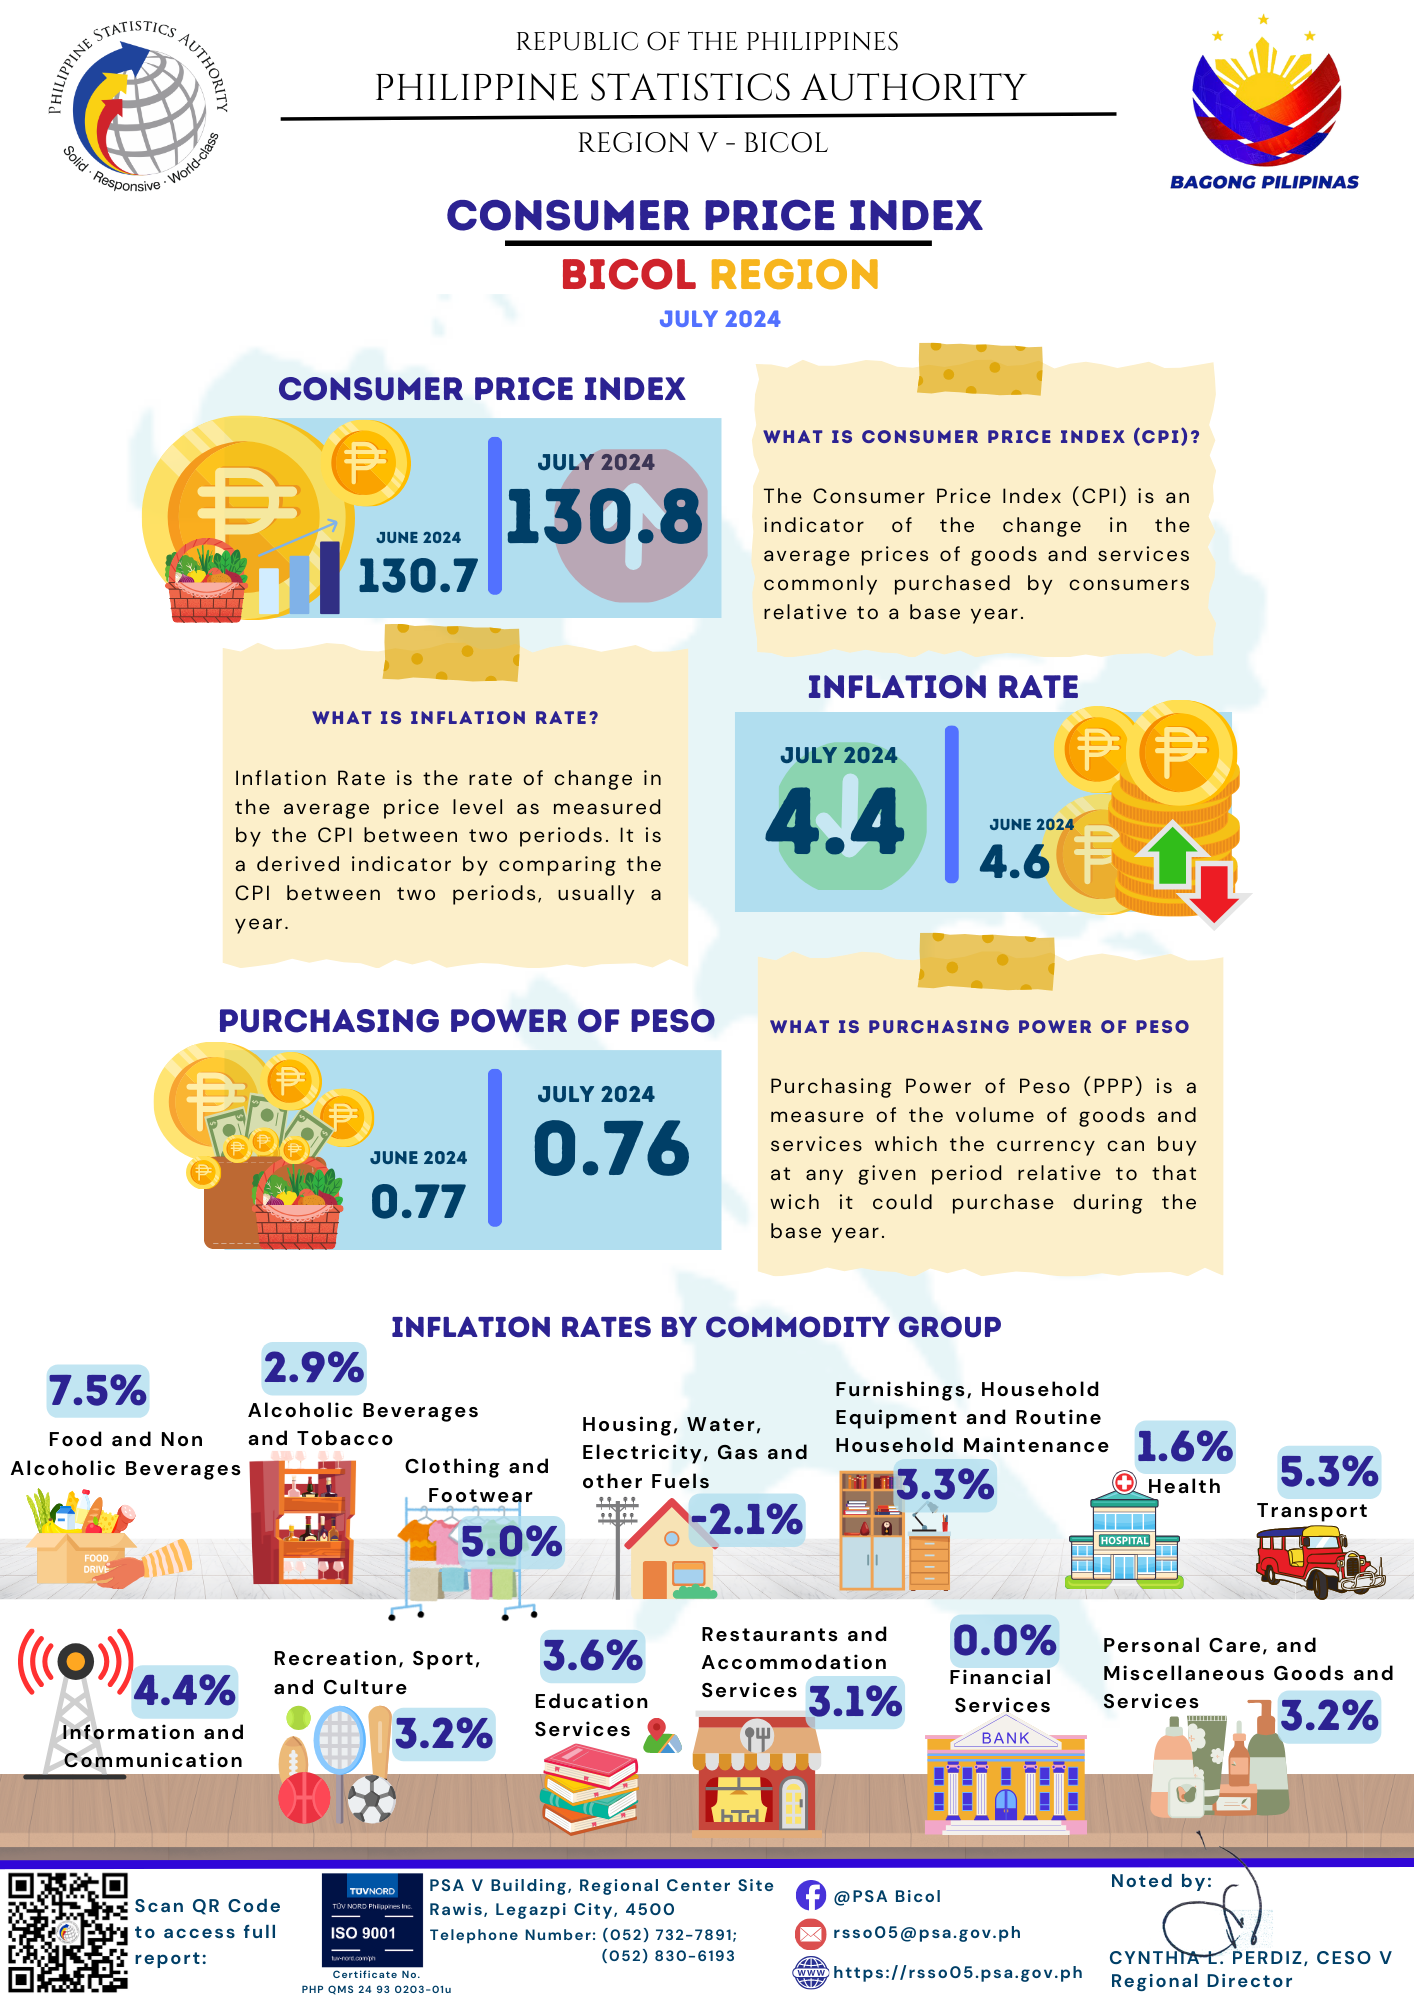
The inflation rate is the annual or monthly rate of change of the CPI expressed in percent. Inflation is interpreted in terms of declining purchasing power of money.
HEADLINE INFLATION RATE
The headline inflation rate refers to the rate of change in the CPI, a measure of the average standard “basket” of goods and services consumed by a typical family.
YEAR-ON-YEAR INFLATION RATE
Year-On-Year Inflation Rate is the annual percentage change of CPI. For example, the percentage change of CPI between August 2023 and August 2024.
MONTH-ON-MONTH INFLATION RATE
Month-On-Month Inflation Rate is the monthly percentage change of CPI. For example, the percentage changes of CPI between August 2024 and July 2024.
PURCHASING POWER OF PESO (PPP)
The purchasing power of peso (PPP) shows how much peso in the base period is worth in the current period. It is computed as the reciprocal of the CPI for the period under review multiplied by 100.
For example, the PhP 1.00 in 2018 is valued only at PhP 0.78 in 2023.
| Attachment | Size |
|---|---|
|
|
1.22 MB |


")


")
")
")


")
 2015-2022, Bicol Region")
, 2022 Bicol Region")


")


