Occupied housing units in Brgy. Lobong, Bato reaches more than two hundred in 2015
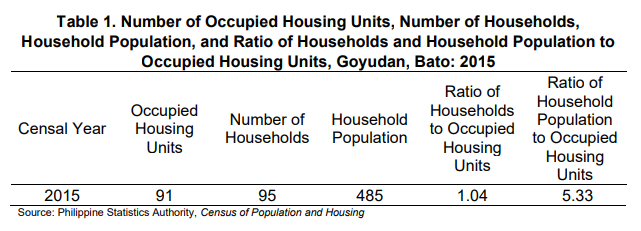
There were less than one hundred occupied housing units in Brgy. Lobong, Bato in 2015. The number of occupied housing units in the barangay reached 91 in 2015.
There are 104 households per 100 occupied housing units in Lobong, Bato
A total of 91 occupied housing units and 95 households were recorded in 2015. This translates to a ratio of 104 households for every 100 occupied housing units, with an average of 5.33 persons per occupied housing unit.
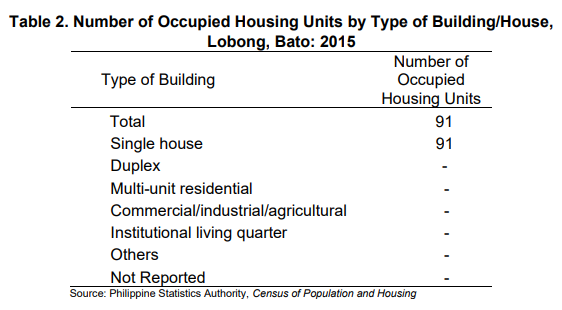
All of the occupied housing units are single houses
In 2015, single houses made up 100.00 percent of the total occupied housing units in Brgy. Lobong.
Most of the occupied housing units with roofs made of
bamboo/cogon/nipa/anahaw
Most of the occupied housing units had roofs made of bamboo/cogon/nipa/anahaw in 2015. In Brgy. Lobong, 81.32 percent of the occupied housing units in 2015 had roofs made of bamboo/cogon/nipa/anahaw. Meanwhile, the proportion of occupied housing units with roofs made of half galvanized iron and half concrete was registered at 17.58 percent while the proportion of housing units with roofs made of galvanized iron/aluminum, was posted at 1.10 percent in 2015.

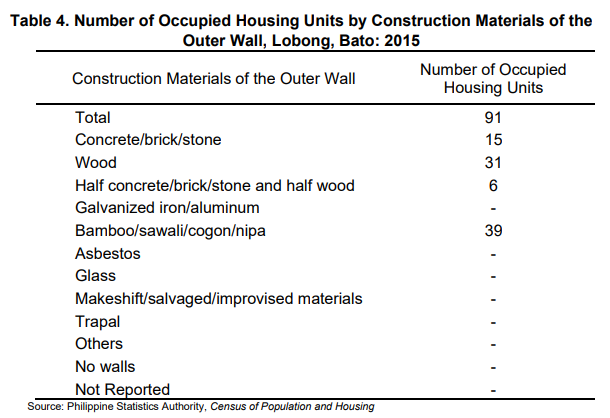
Almost half of the occupied housing units with outer walls made of bamboo/sawali/cogon/nipa in 2015
Almost of the occupied housing units had outer walls made of bamboo/sawali/cogon/nipa in 2015. In Brgy. Lobong, 42.86 percent of the total occupied housing units had outer walls made of bamboo/sawali/cogon/nipa. Meanwhile, the proportion of occupied housing units with outer walls made of half concrete/brick/stone and half wood was posted at 34.07 percent while the proportion of housing units with outer walls made of concrete/brick/stone 16.48 percent in 2015.
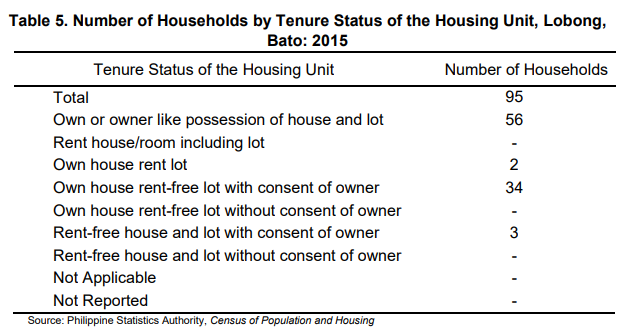
One in every two of the households live in housing units they own or with owner like possession of house and lot
Of the more than two hundred households in Brgy. Lobong in 2015, 58.95 percent lived in a housing unit they own or with owner like possession of house and lot. Moreover, 35.79 percent of the households lived in their own housing unit and rent free lot with consent of owner. In addition, 3.16 percent of the total households lived in their rent free housing unit and lot with consent of the owner. Meanwhile, 2.11 percent of the households lived in their own house but rented lot.
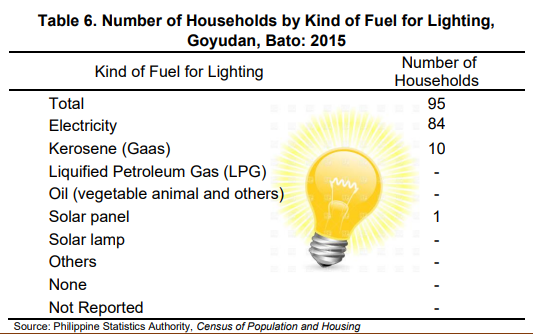
Most of the households in Brgy. Lobong, Bato use electricity as fuel for lighting
Most (88.42%) of the households in Lobong, Bato in 2015 used electricity as fuel for lighting, while kerosene (gaas) ranked second with 10.53 percent of the households using kerosene (gaas) as their source of fuel for lighting in 2015. Meanwhile, 1.05 percent of the total households in the province used solar panel and as their fuel for lightning.
Protected spring is the main source of water supply for drinking in Brgy. Lobong, Bato
Protected spring was listed as the main source of water supply for drinking in Brgy. Lobong, Bato in 2015. Of the total households, majority of the households drew water supply for drinking in protected spring while 2 households drew water supply from drinking from shared faucet community water system and bottled water.
Majority of the households in Brgy. Lobong, Bato reports protected spring as the main source of water supply for cooking
Protected Spring was reported as the main source of water supply for cooking in Brgy. Lobong, Bato in 2015. Of the total households,94 households used protected spring as the main source of water supply for cooking. Shared faucet community water system ranked second as the source of water supply for cooking.

